
danami
Silver Pleskian
Username: danami
TITLE
Advanced Monitoring extension not working with grafana 8.0.0-1
PRODUCT, VERSION, OPERATING SYSTEM, ARCHITECTURE
Product version: Plesk Obsidian 18.0.35.2
OS version: CentOS 8.4.2105 x86_64
Build date: 2021/05/26 11:00
Revision: 79a8872782bd03d98ca90cda78a8ba20d1369c41
PROBLEM DESCRIPTION
After upgrading to grafana 8.0 from the plesk-ext-grafana repository graphs are no longer working when clicking on the advanced monitoring extension.
STEPS TO REPRODUCE
Run yum update on the server to download the new grafana 8.0 from the plesk-ext-grafana repo.
ACTUAL RESULT
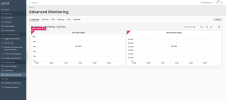
After installing grafana 8.0 graphs cannot be loaded. They just display "Metric request error"
EXPECTED RESULT
Graphs should work.
ANY ADDITIONAL INFORMATION
Downgrading grafana back to 7.5.7-1 fixes the problem:
YOUR EXPECTATIONS FROM PLESK SERVICE TEAM
Confirm bug
TITLE
Advanced Monitoring extension not working with grafana 8.0.0-1
PRODUCT, VERSION, OPERATING SYSTEM, ARCHITECTURE
Product version: Plesk Obsidian 18.0.35.2
OS version: CentOS 8.4.2105 x86_64
Build date: 2021/05/26 11:00
Revision: 79a8872782bd03d98ca90cda78a8ba20d1369c41
PROBLEM DESCRIPTION
After upgrading to grafana 8.0 from the plesk-ext-grafana repository graphs are no longer working when clicking on the advanced monitoring extension.
STEPS TO REPRODUCE
Run yum update on the server to download the new grafana 8.0 from the plesk-ext-grafana repo.
ACTUAL RESULT
After installing grafana 8.0 graphs cannot be loaded. They just display "Metric request error"
EXPECTED RESULT
Graphs should work.
ANY ADDITIONAL INFORMATION
Downgrading grafana back to 7.5.7-1 fixes the problem:
Bash:
yum downgrade grafana-7.5.7-1YOUR EXPECTATIONS FROM PLESK SERVICE TEAM
Confirm bug
Attachments
Last edited: