• Please be aware: Kaspersky Anti-Virus has been deprecated
    With the upgrade to Plesk Obsidian 18.0.64, "Kaspersky Anti-Virus for Servers" will be automatically removed from the servers it is installed on. We recommend that you migrate to Sophos Anti-Virus for Servers.
  • The Horde webmail has been deprecated. Its complete removal is scheduled for April 2025. For details and recommended actions, see the Feature and Deprecation Plan.
  • We’re working on enhancing the Monitoring feature in Plesk, and we could really use your expertise! If you’re open to sharing your experiences with server and website monitoring or providing feedback, we’d love to have a one-hour online meeting with you.

Issue Server is permanently down and unavailable

There is a Fail2ban jail called plesk-apache-badbot, but it uses an outdated list of bots.
I never use it because I had severe server issues (it blocked the wrong IP addresses) caused by that jail.

I created a more up-to-date list of frequently used bots in the post above. I suggest you start with that before activating the fail2ban jail.

it is a real pity that there is no service that allows you to regularly update the plesk-apache-badbot via a script.
i have now added your bot block list to all my domains and restarted the server. now i'm curious to see what happens by tomorrow.
 
I'm in the process of preparing a rather extensive blog article on the topic, which will definitely help to tackle the "high cpu usage" situation for most cases. But for quality assurance reasons I'd like to have it checked by another Plesk person who is currently on vacation. It'll come, but it'll take a while, also until it goes through the publishing process.

For now, the solution that @Maarten. provides, is also excellent. Its big advantage over the typical apache-badbot approach is that it blocks bad bots in Nginx, meaning much less cpu consumption. It has a disadvantage though compared to the apache-badbot solution, too. It still lets traffic through on the network level so that Nginx must take action. Blocking bad bots in the firewall stops that, too, and reduces the load further.
 
Last edited:
Last edited:
There is a Fail2ban jail called plesk-apache-badbot, but it uses an outdated list of bots.
I never use it because I had severe server issues (it blocked the wrong IP addresses) caused by that jail.

I created a more up-to-date list of frequently used bots in the post above. I suggest you start with that before activating the fail2ban jail.

after i added the bot block list to all domains, it unfortunately did not bring the desired success. the domains were all down again the next day until i restarted the server.

after that the memory consumption went up to almost 100% again and the wordpress sites were not accessible again. so i looked at the top consuming processes again. apart from 2 domains, mysql was still displayed with a high cpu and memory consumption.

so i looked at the whole mysql process list. i noticed that some join operations consumed about 40-50mb per process. so i deactivated all caching plugins on the wordpress sites, as well as nginx-caching and reset the memory limit of all domains to default.

since then no domain starts anymore. i only get mostly 503 and partly 502 errors.

in the logfiles of the domains now i see the following error messages:

Code:
[proxy_fcgi:error] (70007)The timeout specified has expired: [client 207.148.11.143:0] AH01075: Error dispatching request to : (polling)), referer: https://www.example.com/

Code:
[proxy_fcgi:error] (104)Connection reset by peer: [client 34.196.51.17:0] AH01075: Error dispatching request to : , referer: https://www.example.com/

Code:
[proxy_fcgi:error] client 207.148.11.143:0] AH01067: Failed to read FastCGI header

should i increase the timeout settings that i once added myself or should i delete them completely?

i don't know whether to laugh or cry anymore
 
Make a plan:
  • undo all cache settings.
  • reboot the server
  • set log rotation for all subscriptions to "By Time: Daily" (via the service plans).
  • check which subscription currently has the largest log files:
Code:
  # ls -rSl /var/www/vhosts/system/*/logs/error_log
  # ls -rSl /var/www/vhosts/system/*/logs/access_ssl_log
  # ls -rSl /var/www/vhosts/system/*/logs/proxy_access_ssl_log
  • disable all subscriptions and leave the one with the largest logfiles enabled.
  • install and start glances. Sort on memory or CPU.
  • let that run for a while and see what it does to the server.
  • if the server is running out of memory, check the log files of that subscription. What's happening there? Bots? Scrapers? PHP errors?
Code:
  # tail -f /var/www/vhosts/system/domain.com/logs/*log
  • if the site with the largest logfiles doesn't bring the server to its knees, enable the following subscription and monitor/check what's happening.

Do this for every site until you've found the problem.
It may take a while, but at least you have a plan now.
 
It has a disadvantage though compared to the apache-badbot solution, too. It still lets traffic through on the network level so that Nginx must take action. Blocking bad bots in the firewall stops that, too, and reduces the load further.
However, nginx is rather fast doing that. Also keep in mind that a bot might retry if it doesn't get a 4xx error.

This would really be a lot easier if plesk had a way to easily integrate varnish. We moved our main site to another server without plesk just so we could add varnish to our site and not risk plesk overwriting the nginx config in an update ...
 
I've never been a big fan of Fail2ban. While it does what it claims to do, it is also a blunt solution. It also blocks good IP addresses, which leads to annoyed customers. That's why I use CrowdSec, where you can block or display a page where visitors can prove they are human.

With CrowdSec, you can also detect and block bad bots.
This is the list they use:
@Maarten. CrowdSec looks promising. Are you using it as a full replacement for fail2ban or in tandem?
 
@Maarten. CrowdSec looks promising. Are you using it as a full replacement for fail2ban or in tandem?

It's completely off-topic, but I found an option in CrowdSec to get an extended ban time for those nasty bots.

In the file /etc/crowdsec/profiles.yaml, uncomment this line:
Code:
#duration_expr: "Sprintf('%dh', (GetDecisionsCount(Alert.GetValue()) + 1) * 4)"

Restart crowdsec and check the logs:
Code:
# tail -f /var/log/crowdsec.log
 
Maybe relevant or maybe not. These are some things I've done in the past to address similar issues with servers that run lots of WP sites and user CPU starts to creep.

- Reduce pm.max.children in PHP settings (did it at the service plan level). I've lowered this to 4 without causing any detectable impact on websites.
- Use FPM application served by NGINX
- In the panel.ini, there are some directives you can use to stop Plesk itself from continuously crawling your sites to generate thumb nail images to display for each domain in Plesk (this was a huge reduction in CPU for me as this process was spawning PHP-FPM's like crazy for WordPress sites)
- Use fail2ban to check for login probes against WordPress. I block an IP after 1 bad login for 5 minutes, and then if same occurs for that IP repeatedly, over short period, drop the hammer on it and block it for a long time (this catches a ton of bad actors)
- Make sure fail2ban is rolling up blocks...so that any IP caught with multiple actions is getting blocked for long periods
- In WP Toolkit, for every WP site, make sure to enable every security setting in the security check
- If memory buffer cache is always super high, implement a cron to clear it hourly.
- Implement Web Application Firewall (modsecurity). I set it to the thorough setting.

I'm sure there have been other small items, but in totality, the above seems to bring CPU down a lot and keep servers in check. No customer complaints either about WP performance.
 
- Reduce pm.max.children in PHP settings (did it at the service plan level). I've lowered this to 4 without causing any detectable impact on websites.
Better not. It does limit hits when bad bots are flooding a site, but it has the potential to slow it down or to make it unresponsive on some requests.

- Use FPM application served by NGINX
Yes, excellent idea. It uses much less resources and responds faster.
- In the panel.ini, there are some directives you can use to stop Plesk itself from continuously crawling your sites to generate thumb nail images to display for each domain in Plesk (this was a huge reduction in CPU for me as this process was spawning PHP-FPM's like crazy for WordPress sites)
These should be very rare visits. There's definitely something wrong if you experience frequent such visits. They are also lazy processes, not even coming close to the impact normal visitors have in time and volume.
- Use fail2ban to check for login probes against WordPress. I block an IP after 1 bad login for 5 minutes, and then if same occurs for that IP repeatedly, over short period, drop the hammer on it and block it for a long time (this catches a ton of bad actors)
Yes.
- Make sure fail2ban is rolling up blocks...so that any IP caught with multiple actions is getting blocked for long periods
Yes, the recidive jail is the one to use for it.
- In WP Toolkit, for every WP site, make sure to enable every security setting in the security check
Absolutely.
- If memory buffer cache is always super high, implement a cron to clear it hourly.
Should not be necessary, but may be on servers with limited RAM or disk space.
- Implement Web Application Firewall (modsecurity). I set it to the thorough setting.
Could be good, but could also be bad, because thorough scans slow down the response.
I'm sure there have been other small items, but in totality, the above seems to bring CPU down a lot and keep servers in check. No customer complaints either about WP performance.
Thanks for sharing. Most of the points I have observed are not done by many users. Good advice here.
 
Better not. It does limit hits when bad bots are flooding a site, but it has the potential to slow it down or to make it unresponsive on some requests.
The problem with fpm is that the pools know nothing about each other and therefore you will get problems with oversubscribing when more than one pool gets considerable load.
 
i have finally found out what the problem is. by using "new relic" i was able to narrow down the problem.

there is a wordpress news site running on the webserver that has over 200,000 posts and retrieves 50 rss feeds once an hour. the high load average is apparently caused by the wp_posts table.

what i cannot say with 100% certainty is whether it is the rss feeds that are causing this load or the caching of the files.

i have now moved this website to another server with 4 cpu cores and 8 gb ram. but the load average is still through the roof at an average of 60-70.

what can i do to get the load down?
 
Would it not be a much better solution to limit RAM usage for the service by cgroups?

hi peter,

as already mentioned, i have moved the site to a new server with 8 cpu cores and 16 gb ram. installed plesk web host and cgroups and activated them under monitor. i have set the limits for the cpu to 560% and the memory to 11 GB. but the server still crashes again and is not accessible.

what else can i do so that the limits are respected and the server finally remains reachable and stable?
do you have any other advice?
 

Attachments

  • 1.jpg
    1.jpg
    85.3 KB · Views: 6
  • 2.jpg
    2.jpg
    49.7 KB · Views: 6
  • 3.jpg
    3.jpg
    44.1 KB · Views: 6
[...]
i have set the limits for the cpu to 560% and the memory to 11 GB. but the server still crashes again and is not accessible.
[...]

I have little experience with cgroups, but the values your are using seem a bit excessive to me. Did you monitor the subscription of this particular website in Plesk (using the Build-in Monitoring)? If so, does the subscription actually show this kind of resource usage?
 
I have little experience with cgroups, but the values your are using seem a bit excessive to me. Did you monitor the subscription of this particular website in Plesk (using the Build-in Monitoring)? If so, does the subscription actually show this kind of resource usage?

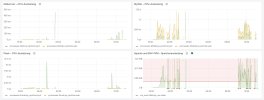
yes, since i put the brand new server into operation yesterday, this load has been displayed (see screenshot).
 

Attachments

  • 4.jpg
    4.jpg
    99.6 KB · Views: 19
yes, since i put the brand new server into operation yesterday, this load has been displayed (see screenshot).

Unfortunately I don't know the answer to your question about cgroups. But I can share a few observations based on your screenshot.
  • The screenshot is actually not of a particular subscription, but of various services (Mail server, Mysql, Plesk and Apache). Which is useful, but if you run multiple websites on the server it can be even more useful to monitor to resources of each subscription too. That way you can easily determine which subscription (website) is using resources at what time. (If you only run one website on the server there is of course little benefit). More information on subscription monitoring (and cgroups) can be found here: How to Use Cgroups Manager to Increase Website Performance

  • Although the graphs in your screenshot only cover a small time frame, there seems to be quite a bit of idle time and high peaks at other times. To me this indicates that the website(s) on your server actually do not have a lot of traffic. But when traffic does hit your site(s), it uses a lot of resources. Which is a shame really. Because a server with 8 CPU cores and 16GB ram is a bit of overkill for a low traffic site (but opinions may differ).

    You've already did a analysis of the website with New Relic and discovered that (most of) the load is caused with the wp_posts database table. Which is really useful information, as it (likely) pin points to cause of the load of your server. But it's easy to misinterpretatie that information. From experience I can say that it is (probably) not caused by the database or the database table, but likely by the query (or queries) made to the database. So instead of increasing or limiting the server resources, why not optimize the website instead? If you developed the website on your server yourself see if you can optimize your code and database queries. Otherwise try to see if you can limit the size of the requests made to the database (either in number of queries or in the amount records requested) in any other way. For example by experimenting with replacing plugins or the theme the reduce load.

    That's probably not a fun job, but if your website is actually low traffic then optimizing your website is really the only way to go. Because if your website becomes more popular and traffic would grow, you'll probably need a monster server to accommodate the growth (and your current server is already quite beefy).
I hope this provides some food for thought and helps you on your quest.

hey kaspar, thanks for getting back.

you saw that correctly. the screenshot doesn't refer to a specific subscription. but since i only have this one website running on this server, the result is actually the same. i had to take the website down from my previous server because all the other sites on the server were always down due to the loss of resources. but apparently the current server isn't powerful enough for a single site either.

is it because the site has over 200,000 posts? to be honest, i don't care if i solve the problem with cgroups or something else. the main thing is to get it solved soon. i've been working on this problem every day for over a month now and i'm really going mad!

i also tried my luck directly on the site and uninstalled unnecessary plugins. the only way i can explain the peaks is that 50 rss feeds are retrieved once an hour to feed the site with news, then sent to google and bots crawl the site. the interval used to be even shorter before and retrieved the rss feeds every 15 minutes.

i know the link you sent me. i worked through it exactly as it was described there.

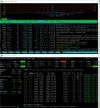
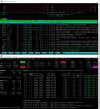
do you have any ideas on how to get the server stable, even if it slows down a bit? the main thing is that it doesn't go down. attached is a screenshot of "htop" and "glances".
 

Attachments

  • 5.jpg
    5.jpg
    273.2 KB · Views: 12
  • 6.jpg
    6.jpg
    251 KB · Views: 10
Back
Top