• If you are still using CentOS 7.9, it's time to convert to Alma 8 with the free centos2alma tool by Plesk or Plesk Migrator. Please let us know your experiences or concerns in this thread:
    CentOS2Alma discussion
  • Please beaware of a breaking change in the REST API on the next Plesk release (18.0.62).
    Starting from Plesk Obsidian 18.0.62, requests to REST API containing the Content-Type header with a media-type directive other than “application/json” will result in the HTTP “415 Unsupported Media Type” client error response code. Read more here

Resolved Getting the error message "452 4.3.1 Insufficient system storage"

cmartinez127

Basic Pleskian
Server operating system version
CentOS 7
Plesk version and microupdate number
18.0.60 #1
Hi, a few days ago this message started to appear in our maillog:
It always starts around 04:12AM and it lasts less than 10 minutes.
The affected accounts are in most of the cases the same three.
Postfix and Amavis are the ones who complain about it, Postfix is my SMTP server and I got Amavis from "Plesk Email Security" extension.
And we are using SpamExperts as the spam filter.
1715943060517.png

Yes, the error message indicates that my server storage is almost full when that's not true, 29GB left is more than enough for email.
1715945343377.png

I checked email accounts quota and most of them are unlimited or are far from reaching the limit, so I do not know what is causing those error messages.
I attached main.cf file in the .zip, it could be useful.

I already looked up for other posts here in Plesk or outside. Unfortunately none of them solved the problem, that's why I'm posting this.
Any help would be very appreciated.
If I can provide any other data, please just let me know.
 

Attachments

  • postconf.zip
    1.3 KB · Views: 2
Just a wild guess, since you mention that it only lasts for about 10 minutes, could it be because of a backup running? Temporarily taking up disk space?
 
Just a wild guess, since you mention that it only lasts for about 10 minutes, could it be because of a backup running? Temporarily taking up disk space?

Hi @Kaspar@Plesk , backups start daily at 3:14. These backups are stored on an external server, full backups weigh 91GB and incremental ones no more than 1GB.

The /var/lib/psa/dumps directory it's just 1,2GB.

On May 18 nothing was logged, but it happened again yesterday. The strange thign is that only one entry was logged:
1716190284893.png

Could still be related? Or if you know any other guess about this issue.

Now our clients reported that for a few weeks they noticed that root@[ ANYDOMAIN ] and postmaster@[ ANYDOMAIN ] emails go to spam, but I'm not sure if this is related to the first problem.
 
The most common cause is a (almost) full disk or a mailbox which has reached their quota. I suppose in theory it could be caused by insufficient inodes. But in that case you would have a whole range of other issues too. None the less, you can check your inodes usage with df -ih.

Do you have monitoring installed? That would help you to see if previously your disk space reached it's limit.
Scherm­afbeelding 2024-05-20 om 10.03.05.png

Now our clients reported that for a few weeks they noticed that root@[ ANYDOMAIN ] and postmaster@[ ANYDOMAIN ] emails go to spam, but I'm not sure if this is related to the first problem.
I am pretty sure that's unrelated and caused by something else (probably failed DMARC validation).
 
The most common cause is a (almost) full disk or a mailbox which has reached their quota. I suppose in theory it could be caused by insufficient inodes. But in that case you would have a whole range of other issues too. None the less, you can check your inodes usage with df -ih.

Do you have monitoring installed? That would help you to see if previously your disk space reached it's limit.
View attachment 26232


I am pretty sure that's unrelated and caused by something else (probably failed DMARC validation).

Hi, thanks for replying.

Inodes aren't the problem, only 3% (57MB) are being used and none of the mailboxes have reached their quota.

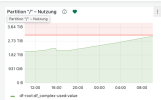
I don't have monitoring extension installed. Fortunately, the server is monitored by Grafana. This is what I see:
95% was the highest space utlization I got in a week, the rest of the peaks are just 90%, while currently 86% is being used.
1716193662842.png

This must be the source of the problem, as you already said backups cause the problem. The hours coincide with those of the incident and the peaks start growing at 3:00, exactly the same scheduled time for backups.

Thank you for your help, you can mark this as solved!
 
Back
Top