• Please be aware: Kaspersky Anti-Virus has been deprecated
    With the upgrade to Plesk Obsidian 18.0.64, "Kaspersky Anti-Virus for Servers" will be automatically removed from the servers it is installed on. We recommend that you migrate to Sophos Anti-Virus for Servers.
  • The Horde webmail has been deprecated. Its complete removal is scheduled for April 2025. For details and recommended actions, see the Feature and Deprecation Plan.
  • We’re working on enhancing the Monitoring feature in Plesk, and we could really use your expertise! If you’re open to sharing your experiences with server and website monitoring or providing feedback, we’d love to have a one-hour online meeting with you.

Issue Apache hangs with no load every 2-4 days

nkomarov

New Pleskian
Hi there,
I have a VPS at a German provider Strato, they rolled out Ubuntu with Plesk pre-installed. Currently it's Plesk Obsidian Web Admin Edition Version 18.0.36.

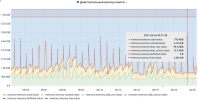
Every 2-4 days early in the morning (like, at 3-34 or 4-10 AM) Apache stops responding to external requests. There is a trivial installation of WordPress + WooCommerce with some plugins, nothing special. No load whatsoever because we're only preparing the shop, only authenticated users go beyond "Under Construction" page - but still it hangs, I also see some strange memory usage graph. Nothing special in the Apache error log. Apache restart helps for 2-4 days, then it happens again. I checked what cron tasks are there but there is nothing in this timeframe.

Running with PHP version 7.3.28 (available 7.4.20), run PHP as FPM application.

Could I enable some additional logging? I could also try daily restart of Apache but I'd better try to find the true reason of this issue.
 

Attachments

  • 2021-06-25_cr.png
    2021-06-25_cr.png
    196.1 KB · Views: 14
Last edited:
Thanks for an idea! That also was one of my primary suspitions so the first thing I did was moving it closer ot 1:00 AM. By the time this happens, that wp-cron.php has already finished hours ago. But it still happens.
 
Nothing in any logs? Is there any Apache restart/reload? Are you hitting request worker limits?
 
There are three places to check:
  1. The website's error log in Plesk
  2. Enable the WordPress error log file
  3. The error log for your PHP handler
For a site that isn't yet launched, this sounds more like an uncontained code leak however it's too soon to tell.

Be sure to check to ensure that Apache is set to gracefully restart as well. While the issuance of SSL certificates should not be daily (unless there are failures each time) and this setting likely has nothing to do with your issue, it's still a good practice.
 
Yes, the checkbox of graceful restart has been on since day 1.

When site was unreachable I went to the /admin/services/list page of Plesk and could see that the service is running so I thought it is "hanging" but I feel like it was wrongly shown as running whilst actually crashed. Seems like an issue in Plesk: it only shows the service as "stopped" if it has been stopped from this page; it doesn't check if services are actually running upon page loading.

I've installed the Watchdog extension and found out that these crashes happened more often but I just didn't notice that. It's been also down/up during the day but I only could see it since I've installed Watchdog. I'm not sure if restarts happened before too. I only know that before there were some early morning crashes without restart.

In the access/error log I see:
2021-06-27 11:02:01Access200GET /wp-cron.php?doing_wp_cron HTTP/1.1
And soon I received per email: "Apache is down. The problem was discovered on Jun 28, 2021 11:04 AM."

Then it hangs again but without a corresponding wp-cron call: "The problem was discovered on Jun 28, 2021 11:26 AM. "

Then there is a wp-cron call without a correponding crash...
2021-06-27 12:02:01Access85.214.71.120200GET /wp-cron.php?doing_wp_cron HTTP/1.1

So there is no strict correlation between these. I had a define('DISABLE_WP_CRON', true); record in config.php but it didn't work... Now I've changed it to define('DISABLE_WP_CRON', 'true'); - hope it will ultimately disable wp-cron.

Typing "journalctl -u apache2.service --since today --no-pager" returned (by the way, is there a way to see these things from Plesk itself?):
Jun 28 03:26:32 XXX.stratoserver.net systemd[1]: apache2.service: Control process exited, code=exited status=2
Jun 28 03:26:32 XXX.stratoserver.net systemd[1]: Reload failed for The Apache HTTP Server.
Jun 28 03:26:45 XXX.stratoserver.net systemd[1]: Stopping The Apache HTTP Server...
Jun 28 03:26:45 XXX.stratoserver.net apachectl[32077]: /usr/sbin/apachectl: 98: /usr/sbin/apachectl: Cannot fork
Jun 28 03:26:45 XXX.stratoserver.net systemd[1]: apache2.service: Control process exited, code=exited status=2
Jun 28 03:26:56 XXX.stratoserver.net systemd[1]: apache2.service: Failed with result 'exit-code'.
Jun 28 03:26:56 XXX.stratoserver.net systemd[1]: Stopped The Apache HTTP Server.
Jun 28 03:26:56 XXX.stratoserver.net systemd[1]: Starting The Apache HTTP Server...
Jun 28 03:26:57 XXX.stratoserver.net systemd[1]: Started The Apache HTTP Server.
Jun 28 03:27:00 XXX.stratoserver.net systemd[1]: Reloading The Apache HTTP Server.
Jun 28 03:27:01 XXX.stratoserver.net systemd[1]: Reloaded The Apache HTTP Server.
Jun 28 11:04:48 XXX.stratoserver.net systemd[1]: Stopping The Apache HTTP Server...
Jun 28 11:04:48 XXX.stratoserver.net systemd[1]: apache2.service: Control process exited, code=exited status=2
Jun 28 11:05:59 XXX.stratoserver.net systemd[1]: apache2.service: Failed with result 'exit-code'.
Jun 28 11:05:59 XXX.stratoserver.net systemd[1]: Stopped The Apache HTTP Server.
Jun 28 11:05:59 XXX.stratoserver.net systemd[1]: Starting The Apache HTTP Server...
Jun 28 11:06:00 XXX.stratoserver.net systemd[1]: Started The Apache HTTP Server.
Jun 28 11:26:13 XXX.stratoserver.net systemd[1]: Stopping The Apache HTTP Server...
Jun 28 11:26:13 XXX.stratoserver.net systemd[1]: apache2.service: Control process exited, code=exited status=2
Jun 28 11:26:23 XXX.stratoserver.net systemd[1]: apache2.service: Failed with result 'exit-code'.
Jun 28 11:26:23 XXX.stratoserver.net systemd[1]: Stopped The Apache HTTP Server.
Jun 28 11:26:24 XXX.stratoserver.net systemd[1]: Starting The Apache HTTP Server...
Jun 28 11:26:24 XXX.stratoserver.net systemd[1]: Started The Apache HTTP Server.
Jun 28 12:13:22 XXX.stratoserver.net systemd[1]: Stopping The Apache HTTP Server...
Jun 28 12:13:22 XXX.stratoserver.net apachectl[17974]: /usr/sbin/apachectl: 98: /usr/sbin/apachectl: Cannot fork
Jun 28 12:13:22 XXX.stratoserver.net systemd[1]: apache2.service: Control process exited, code=exited status=2
Jun 28 12:13:33 XXX.stratoserver.net systemd[1]: apache2.service: Failed with result 'exit-code'.
Jun 28 12:13:33 XXX.stratoserver.net systemd[1]: Stopped The Apache HTTP Server.
Jun 28 12:13:33 XXX.stratoserver.net systemd[1]: Starting The Apache HTTP Server...
Jun 28 12:13:33 XXX.stratoserver.net systemd[1]: Started The Apache HTTP Server.
So I tried "tail -n 500 /var/log/apache2/error.log | grep err", this returned:
(dozens of same messages like these three below)
[Mon Jun 28 11:05:18.795193 2021] [mpm_event:error] [pid 32146:tid 140438082923456] (11)Resource temporarily unavailable: AH00481: fork: Unable to fork new process
[Mon Jun 28 11:05:28.810980 2021] [mpm_event:error] [pid 32146:tid 140438082923456] (11)Resource temporarily unavailable: AH00481: fork: Unable to fork new process
[Mon Jun 28 11:05:38.829117 2021] [mpm_event:error] [pid 32146:tid 140438082923456] (11)Resource temporarily unavailable: AH00481: fork: Unable to fork new process
[Mon Jun 28 11:05:58.192783 2021] [core:error] [pid 32146:tid 140438082923456] AH00046: child process 900 still did not exit, sending a SIGKILL
[Mon Jun 28 11:05:58.214747 2021] [core:error] [pid 32146:tid 140438082923456] AH00046: child process 6388 still did not exit, sending a SIGKILL
[Mon Jun 28 11:10:48.391960 2021] [pagespeed:error] [pid 15530:tid 140681175623424] [mod_pagespeed 1.13.35.2-0 @15530] [0628/111048:ERROR:worker.cc(127)] Unable to start worker thread
[Mon Jun 28 11:24:14.819923 2021] [pagespeed:error] [pid 15531:tid 140682769450752] [mod_pagespeed 1.13.35.2-0 @15531] [0628/112414:ERROR:worker.cc(127)] Unable to start worker thread
[Mon Jun 28 11:26:22.525757 2021] [core:error] [pid 15526:tid 140683605941184] AH00046: child process 15530 still did not exit, sending a SIGKILL
[Mon Jun 28 12:08:57.393869 2021] [pagespeed:error] [pid 16067:tid 140594638726912] [mod_pagespeed 1.13.35.2-0 @16067] [0628/120857:ERROR:worker.cc(127)] Unable to start worker thread
[Mon Jun 28 12:08:57.400368 2021] [pagespeed:error] [pid 16067:tid 140594638726912] [mod_pagespeed 1.13.35.2-0 @16067] [0628/120857:ERROR:worker.cc(127)] Unable to start worker thread
[Mon Jun 28 12:13:31.988520 2021] [core:error] [pid 16062:tid 140595272010688] AH00046: child process 16067 still did not exit, sending a SIGKILL
Why do I see nothing like this in the Apache Logs in Plesk?

So I've disabled Apache module pagespeed and restarted Apache2. Will see what happens.
 
Last edited:
fork: Unable to fork new process

=> Your VPS is running out of resources, most probably related to kmemsize limits set by Strato. Check your /var/log/messages (or /var/log/syslog, /var/log/kernel.log) for any errors related to resources.

I think you'll have to contact Strato support about this. It looks like your VPS needs more resources....
I checked htop and it shows that only 1G of 8G RAM is used. I've changed PHP memory limit from 256M to 512M (usage in htop raised slightly) and hope it will also help.

I'll check these files tomorrow, thanks.

EDIT: after 6 hours I don't see further errors like shown above. Maybe 256M limit in PHP settings was not high enough.
 
Last edited:
Plesk Version 18.0.36 MIGHT have a BUG, POSSIBLY related to Plesk changing some memory allocation configuration, without user consent.

Also have a look at:
 
I checked htop and it shows that only 1G of 8G RAM is used. I've changed PHP memory limit from 256M to 512M (usage in htop raised slightly) and hope it will also help.

I'll check these files tomorrow, thanks.

EDIT: after 6 hours I don't see further errors like shown above. Maybe 256M limit in PHP settings was not high enough.
You're not running mod_php/cgi are you?

Edit: Ignore my reply. I re-read your initial thread

Edit2: Have you checked your system logs? There's lots of things that can prevent forking - ie, kernel/security limits . I'd also take a look at some monitoring to see just how many processes are being forked, and why that's happening.

It's quite odd that raising the PHP mem limit would help. Do keep us updated.

Edit3: In your initial graph, you show multiple spikes in memory usage. Do these coincide with Apache restarts?
 
Last edited:
The spikes are still there, today at 3:06 AM, it might be daily backup. On the other hand, there were spikes in "Apache & php-fpm usage" at 2:51 and 4:01 AM.
1624957895412.png

There were some restarts as well:
journalctl -u apache2.service --since today --no-pager
-- Logs begin at Wed 2021-05-19 17:14:36 CEST, end at Tue 2021-06-29 11:18:54 CEST. --
Jun 29 03:26:06 XXX.stratoserver.net systemd[1]: Reloading The Apache HTTP Server.
Jun 29 03:26:07 XXX.stratoserver.net systemd[1]: Reloaded The Apache HTTP Server.
Jun 29 03:26:12 XXX.stratoserver.net systemd[1]: Reloading The Apache HTTP Server.
Jun 29 03:26:13 XXX.stratoserver.net systemd[1]: Reloaded The Apache HTTP Server.

Well, at least no more "Unable to fork new process" messages.

And in the Apache logs there are only ModSecurity errors like "Access denied" because of hackers were trying some XSS-prone URLs.

And cron-wp.php is called no more, last edit helped.

I also restarted mysqld, memory consumption fell 200M lower.
 
Server spikes around midnight or 3/4 AM happen due to cron runs.

Host provider may bring instance to go off-line when resources pass a certain limit as 60% of "burstable" server capacity on AWS.
 
The spikes are still there, today at 3:06 AM, it might be daily backup. On the other hand, there were spikes in "Apache & php-fpm usage" at 2:51 and 4:01 AM.
View attachment 18975

There were some restarts as well:


Well, at least no more "Unable to fork new process" messages.

And in the Apache logs there are only ModSecurity errors like "Access denied" because of hackers were trying some XSS-prone URLs.

And cron-wp.php is called no more, last edit helped.

I also restarted mysqld, memory consumption fell 200M lower.
Reloads are normal. As long as there isn't any downtime, Apache reloads are to be expected. The spikes are interesting - anything in logs around that time? I would also look into exactly what is causing those spiked - PHP or Apache?
 
Back
Top