• Please be aware: Kaspersky Anti-Virus has been deprecated
    With the upgrade to Plesk Obsidian 18.0.64, "Kaspersky Anti-Virus for Servers" will be automatically removed from the servers it is installed on. We recommend that you migrate to Sophos Anti-Virus for Servers.
  • The Horde webmail has been deprecated. Its complete removal is scheduled for April 2025. For details and recommended actions, see the Feature and Deprecation Plan.

Issue Something changed badly after reboot

ic3_2k

New Pleskian
Server operating system version
Almalinux 8.9
Plesk version and microupdate number
18.0.61 #5
Hi everybody!

This weekend the server stoped working, I connected to the KVM and a beautifull 'kernel panic' was wairign for me, luckly after a forces reboot the only problem I found (at first) was one of the disk was taken out the raid, I added it again after checking there was no errors on the disk, and everything look'd ok.

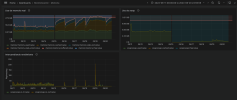
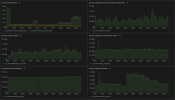
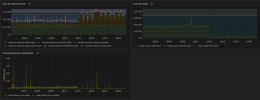
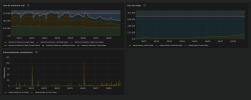
But after only 2 days the webpages started to going slower and slower, so I checked monitor and saw that something changed on hoy the system manage the memory after the reboot, as you can see before the reboot it memory consumption never was more than 18.5Gb and the swap was allways over 4.5Gb, after the reboot the memory consumption went crazy and the swap is likely not used as before:
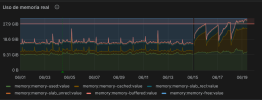
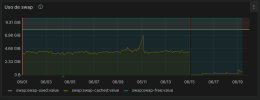
1718784167276.png1718784136934.png
Suscription CPU or Memory s the same as before:
,
1718784394450.png
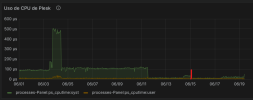
Also plesk consumptions (reset is marked red):
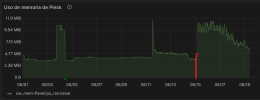
1718784533830.png1718784489769.png

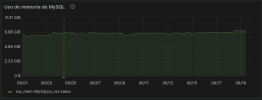
Mysql is same as always:
1718784588927.png

Can someone helpme to know what is happening?

Thank you all!!!
 
It could be the RAID configuration, i.e. that it's still rebuilding the RAID array.

Did you check the logfiles like /var/log/messages or the processes with htop or glances commands?
 
hello, and thanks for the answer

The raid is in good health and the recostruction took over 36 minutes only:

Bash:
[root]# cat /proc/mdstat
Personalities : [raid1]
md2 : active raid1 nvme0n1p2[2] nvme1n1p2[1]
      1046528 blocks super 1.2 [2/2] [UU]

md3 : active raid1 nvme0n1p3[0] nvme1n1p3[1]
      493131776 blocks super 1.2 [2/2] [UU]
      bitmap: 4/4 pages [16KB], 65536KB chunk

unused devices: <none>
[root]# mdadm --query --detail /dev/md{2,3}
/dev/md2:
           Version : 1.2
     Creation Time : Tue Apr 30 11:45:43 2024
        Raid Level : raid1
        Array Size : 1046528 (1022.00 MiB 1071.64 MB)
     Used Dev Size : 1046528 (1022.00 MiB 1071.64 MB)
      Raid Devices : 2
     Total Devices : 2
       Persistence : Superblock is persistent

       Update Time : Thu Jun 20 15:03:57 2024
             State : clean
    Active Devices : 2
   Working Devices : 2
    Failed Devices : 0
     Spare Devices : 0

Consistency Policy : resync

              Name : md2
              UUID : 9590b356:2a61ab94:d17f87f2:68ff96d4
            Events : 7395

    Number   Major   Minor   RaidDevice State
       2     259        7        0      active sync   /dev/nvme0n1p2
       1     259        3        1      active sync   /dev/nvme1n1p2
/dev/md3:
           Version : 1.2
     Creation Time : Tue Apr 30 11:45:44 2024
        Raid Level : raid1
        Array Size : 493131776 (470.29 GiB 504.97 GB)
     Used Dev Size : 493131776 (470.29 GiB 504.97 GB)
      Raid Devices : 2
     Total Devices : 2
       Persistence : Superblock is persistent

     Intent Bitmap : Internal

       Update Time : Thu Jun 20 15:05:34 2024
             State : clean
    Active Devices : 2
   Working Devices : 2
    Failed Devices : 0
     Spare Devices : 0

Consistency Policy : bitmap

              Name : md3
              UUID : b187ede9:1b15301f:91acec36:93c42492
            Events : 513607

    Number   Major   Minor   RaidDevice State
       0     259        8        0      active sync   /dev/nvme0n1p3
       1     259        4        1      active sync   /dev/nvme1n1p3
[root]#

Also I don't see anything weird on htop beyond the consupmtion bumps you can see on the monitoring screenshots: now the cached memory grows up until eat all the available ram and once it reach that point, the cache and slab drops down again repeating this cycle over and over again.
I tied to seek on the dmes, journalctl and messages.log the messages happening in the time range when this happens and didn't see anything interesting...

Before this memory issue the server was running in stable for almost a year

1718888664042.png

Mysql, which usually is the source of memory problems has the same consumption as before the reboot:
1718889238265.png

Any other suggestion¿? Would be pleased to check anything you can suggest ;)
 
The sawtooth-like pattern in your server's real memory consumption can occur due to various reasons such as periodic tasks, garbage collection processes, or caching mechanisms. It's generally not a cause for concern unless you're experiencing performance issues or unexpected crashes.

Regarding your worries about the swap file, it’s important to understand how Linux manages memory. When it seems like your system is using a lot of swap, it might work as intended to optimize performance. I recommend reading this helpful page: Linux Ate My RAM for more detailed insights. This resource explains why high memory usage is often not a problem and how Linux handles memory management efficiently.
 
I have no worries about swap....

My worries are about the poorly performing cutomer's webpages several hours per day, every single day, after the kernel panic happened

I only know that when web pages are behaving slowly, the RAM consumption is at one of the peaks that can be seen in the screenshot. I did mention the swap because it is the only other graph with visible changes. CPU is the same, MySQL is the same, etc.

Before this happening, RAM memory consumption was always more or less the same, with the total being below 18Gb at all times, as was the swap, which maintained a stable use of about 2.5 or 3Gb.

I know a little bit about linux and ram, let's say I'm at user level ;)
If you show me a graph like this one I would say there's no problem with memory, the used memory is still the same over 9.31Gb so you have available over 21Gb (Cache+free) but the fact is webpages now are behaving slow up to the point to respond with '50X' errors every day and customers are angry
1719329896607.png

What I don't understand is why it behaved better before, when the cache was on the swap partition, than now storing the cache all in RAM.
 
Without having access to your server it's very hard to tell what's going on.
You need to look at the logfiles of the sites that perform badly, i.e. the /var/www/vhosts/system/domain.com/logs/error_log and proxy_access_ssl_log.

If you are familiar with the command line, go to those locations and use the "tail" command to see what's going on:
Code:
# cd /var/www/vhosts/system/domain.com/logs
# tail -f error_log
# tail -f proxy_access_ssl_log

Hit Ctrl+C to stop the logging.
{/code]

Reload the site a few times and in the meantime have a look at the log files.
 
The smart-log of your nvme ssds is okay?
What does iotop / htop say about iowait?
Did you ever find out the reason for the crash?
Are all fans running properly? Anything blocking the airflow?
 
Did you verify that fail2ban has started? Sometimes it cannot start after a reboot, because log files that were previously there where meanwhile deleted. A server without fail2ban will get much useless traffic. This could cause a higher cpu and memory load.
 
Thank for the answers!!!

@mow
Smart log shows no errors.
Code:
Error Information (NVMe Log 0x01, max 64 entries)
No Errors Logged
Error Information (NVMe Log 0x01, max 64 entries)
Also no high values at iotop

Didn't ever found the source of the kernel painc error... I had to reboot the server to put ir back at work asap loosing in the way all dmesg and kernel logs, they were overwritten by the new boot proccess messages

It is a bare-metal server on a datacenter, so it is few thoushand kilometers away than I feel comfortsble to go to check the ventilators ;-)
But what i can say is that temerature sensors shows values between 42ºC and 51ºC so I think ventilation must be ok

@Bitpalast
I have imunifi360 installed so fail2ban is disabled as there is incompatibilites between them

IDK I hate then this kind of things happens, since yesterday looks like the system start to behave normal again, so now I only know that something unknown caused a kernel panic and after that the server was behaving weird about 12 days...
So this can happens again at any moment
1719603928179.png
 
Back
Top