Denis Gomes Franco
Regular Pleskian
Hello everyone. I need some help in identifying periodic extremely high usage in one of my servers (however, I have two and the same issue happens on the other as well).
From time to time CPU and memory usage goes through the roof:
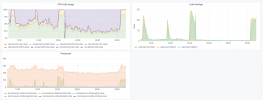
That Grafana log is for the past 24 hours, note that it happened three more times. The "valley" in the middle is me rebooting the server. That last spike was happening right now and as misteriously as it started, it has now ended.
This server has fairly large specs: 12 cores and 48 GB RAM, located at Upcloud. The other server is way smaller and is located at Linode. Both rarely go over 75% CPU usage at any point in time. All of them host Wordpress and Woocommerce sites developed by us. We run a managed hosting business so we know personally each and every site owner, and no customer has access to the Plesk panel.
We have the New Relic agent installed on both servers but I'm fairly new to this tool and I am not so sure how to use it to debug things. Anyway, I have set up the agent so that New Relic will show statistics for each site independently, instead of aggregated inside one "PHP APPLICATION" group.
Outbound network traffic did not seem to go up beyond what's considered normal, so I don't think it's a DDOS but I might be wrong.
All of the sites are low in traffic. Peak usage does not seem to correlate with any exceptional events (eg, a shop owner throwing a sale and bringing in lots of visitors).
All sites are running on PHP-FPM and NGINX with MariaDB 10. Apache is completely disabled for all sites. I would even uninstall Apache but Plesk wont let me.
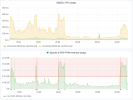
Apache CPU usage, Apache & PHP-FPM memory usage and MySQL CPU usage all go fairly wild, while MySQL memory usage stays more or less the same.
Using the Process List and MySQL Process List does not seem to yield any useful information, just as HTOP.
All plugins used in all sites are always kept up to date, including Elementor which had a vulnerability fixed in the last few days.
I'm aware that this case will require some digging, so I don't expect a solution right away, but if someone can point me in the right direction or provide any useful info, I would be very grateful.
From time to time CPU and memory usage goes through the roof:

That Grafana log is for the past 24 hours, note that it happened three more times. The "valley" in the middle is me rebooting the server. That last spike was happening right now and as misteriously as it started, it has now ended.
This server has fairly large specs: 12 cores and 48 GB RAM, located at Upcloud. The other server is way smaller and is located at Linode. Both rarely go over 75% CPU usage at any point in time. All of them host Wordpress and Woocommerce sites developed by us. We run a managed hosting business so we know personally each and every site owner, and no customer has access to the Plesk panel.
We have the New Relic agent installed on both servers but I'm fairly new to this tool and I am not so sure how to use it to debug things. Anyway, I have set up the agent so that New Relic will show statistics for each site independently, instead of aggregated inside one "PHP APPLICATION" group.
Outbound network traffic did not seem to go up beyond what's considered normal, so I don't think it's a DDOS but I might be wrong.
All of the sites are low in traffic. Peak usage does not seem to correlate with any exceptional events (eg, a shop owner throwing a sale and bringing in lots of visitors).
All sites are running on PHP-FPM and NGINX with MariaDB 10. Apache is completely disabled for all sites. I would even uninstall Apache but Plesk wont let me.

Apache CPU usage, Apache & PHP-FPM memory usage and MySQL CPU usage all go fairly wild, while MySQL memory usage stays more or less the same.
Using the Process List and MySQL Process List does not seem to yield any useful information, just as HTOP.
All plugins used in all sites are always kept up to date, including Elementor which had a vulnerability fixed in the last few days.
I'm aware that this case will require some digging, so I don't expect a solution right away, but if someone can point me in the right direction or provide any useful info, I would be very grateful.

