• If you are still using CentOS 7.9, it's time to convert to Alma 8 with the free centos2alma tool by Plesk or Plesk Migrator. Please let us know your experiences or concerns in this thread:
    CentOS2Alma discussion

Issue Apache 100% CPU each week

hozone

New Pleskian
Hello,

I've a plesk 17.5.3 on a centos 6.9, with apache/2.2.15
It basically runs a single domain, that use 15Gb and have a traffic of 150Gb/month.
It is 2 month from now that on sunday at 3:50 one apache process takes 99% of CPU.
The server runs almost two year with no problem.
No crontab runs at 3:50.
I've build a simple script to check if that process has a request (mod_status), nothing, that is the TOP with attached status of the process, you can see below.

PID USER %CPU %MEM IP DOMAIN REQUEST
30752 apache 99.1 0.2 <--- KILLER PROCES
30818 apache 0.0 0.4 100.100.100.100 mydomain.com GET /modules/page.php HTTP/ <--- other sample line (IP and domain changed for privacy)


I've notice that at 3:50 most of my apache log are rotated, so i think that is the blocking process.
Can the rotation be the blocking process?
Rotation is set as 10Mb, max 10 files.
Webstats is disabled by web plesk interface, but i get access_ssl_log.webstat.

My script runs at 6:00, if the load is high it simply /sbin/service httpd restart then all the things come back to a normal status, and the server is usable.
I've also attached the datadog usage for this server of the last problem of today.

Any suggestion is welcome!

Thank you!
 

Attachments

  • Cattura1.PNG
    Cattura1.PNG
    40.6 KB · Views: 17
  • Cattura2.PNG
    Cattura2.PNG
    129.6 KB · Views: 14
Hello,

I've a plesk 17.5.3 on a centos 6.9, with apache/2.2.15
It basically runs a single domain, that use 15Gb and have a traffic of 150Gb/month.
It is 2 month from now that on sunday at 3:50 one apache process takes 99% of CPU.
The server runs almost two year with no problem.
No crontab runs at 3:50.
I've build a simple script to check if that process has a request (mod_status), nothing, that is the TOP with attached status of the process, you can see below.

PID USER %CPU %MEM IP DOMAIN REQUEST
30752 apache 99.1 0.2 <--- KILLER PROCES
30818 apache 0.0 0.4 100.100.100.100 mydomain.com GET /modules/page.php HTTP/ <--- other sample line (IP and domain changed for privacy)


I've notice that at 3:50 most of my apache log are rotated, so i think that is the blocking process.
Can the rotation be the blocking process?
Rotation is set as 10Mb, max 10 files.
Webstats is disabled by web plesk interface, but i get access_ssl_log.webstat.

My script runs at 6:00, if the load is high it simply /sbin/service httpd restart then all the things come back to a normal status, and the server is usable.
I've also attached the datadog usage for this server of the last problem of today.

Any suggestion is welcome!

Thank you!

Hello,
You can try to disable the logrotate cronjob, but I do not think it's the current issue.
Have you check the 14MB of error logs you have ? It may help you to find the issue
 
@hozone

The comment by @virtubox is right: it certainly is not the logrotate process (and it will never be with your logs of relatively small size).

The most common culprits of Apache resource usage are cronjobs executed by a specific application.

For instance, WordPress cronjobs are notorious for their resource usage. Just shut them down.

Another potential root cause of this particular problem can be the execution of some backup process.

In the latter case, you would find some entry called "pigz" when running top, but it is often more clear to inspect the scheduled tasks in the backup manager.

If a scheduled backup task is running at (or around) the specific time mentioned, try to reschedule the task and check afterwards what happens.

However, I am pretty sure that you have some cronjob running in an application. Have a look at the applications!

Regards.........
 
Thank you virtubox and trialotto

No cron or backup job is executed at that time.

I've a monitor process that use mod_status to bind a requested URI to the apache process, unluckly the 99% CPU apache process is not bind to any URI. Is there anything else i could use to monitor the apache process?
Find below my monitor/restart_if_high_load script.

I've checked the errors log, it has a lot of
Broken pipe: mod_fcgid: can't write spawn command
After the issue happened.
So following this article
After upgrade to Onyx error in website log: mod_fcgid: can't write spawn command
Can it be that?
I've update my FcgidMaxProcesses and other fcgid params (FcgidMaxProcesses previous was 30)

<IfModule mod_fcgid.c>
<IfModule !mod_fastcgi.c>
AddHandler fcgid-script fcg fcgi fpl
</IfModule>
FcgidIPCDir /var/run/mod_fcgid/sock
FcgidProcessTableFile /var/run/mod_fcgid/fcgid_shm
FcgidIdleTimeout 40
FcgidConnectTimeout 30
FcgidIOTimeout 45
FcgidInitialEnv RAILS_ENV production
FcgidIdleScanInterval 10
FcgidMaxProcesses 300
FcgidBusyTimeout 1800
FcgidMinProcessesPerClass 0
FcgidMaxProcessesPerClass 50
FcgidProcessLifeTime 120
</IfModule>


FILE servermonit.sh

#!/bin/bash

# log
LASTRUN=/var/www/vhosts/example.com/servermonit/lastrun
LOGFILE=/var/www/vhosts/example.com/servermonit/load_kill_log
PSFILE=/var/www/vhosts/example.com/servermonit/ps_log
STATUSFILE=/var/www/vhosts/example.com/servermonit/status_log
STATUSFILE2=/var/www/vhosts/example.com/servermonit/status_log2

# obtain the server load
loadavg=`uptime |cut -d , -f 4|cut -d : -f 2`
thisloadavg=`echo $loadavg|awk -F \. '{print $1}'`

echo `date` - LOADAVG $loadavg - LOADAVGINT $thisloadavg > $LASTRUN
echo `date` - LOADAVG $loadavg - LOADAVGINT $thisloadavg

wget -O $STATUSFILE2 http://localhost/server-status
/var/www/vhosts/example.com/servermonit/httop -2 >> $STATUSFILE

if [ "$thisloadavg" -ge "1" ]; then
echo LOAD is high
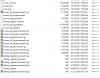
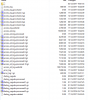
ps auxfww >> $PSFILE
date >> $LOGFILE
/sbin/service httpd restart
fi


FILE httop


#!/usr/bin/perl

# The MIT License (MIT)
#
# Copyright (c) 2014 Razvan C. Cojocariu
#
# Permission is hereby granted, free of charge, to any person obtaining a copy
# of this software and associated documentation files (the "Software"), to deal
# in the Software without restriction, including without limitation the rights
# to use, copy, modify, merge, publish, distribute, sublicense, and/or sell
# copies of the Software, and to permit persons to whom the Software is
# furnished to do so, subject to the following conditions:
#
# The above copyright notice and this permission notice shall be included in all
# copies or substantial portions of the Software.
#
# THE SOFTWARE IS PROVIDED "AS IS", WITHOUT WARRANTY OF ANY KIND, EXPRESS OR
# IMPLIED, INCLUDING BUT NOT LIMITED TO THE WARRANTIES OF MERCHANTABILITY,
# FITNESS FOR A PARTICULAR PURPOSE AND NONINFRINGEMENT. IN NO EVENT SHALL THE
# AUTHORS OR COPYRIGHT HOLDERS BE LIABLE FOR ANY CLAIM, DAMAGES OR OTHER
# LIABILITY, WHETHER IN AN ACTION OF CONTRACT, TORT OR OTHERWISE, ARISING FROM,
# OUT OF OR IN CONNECTION WITH THE SOFTWARE OR THE USE OR OTHER DEALINGS IN THE
# SOFTWARE.


##########################################
# CONFIG
##########################################

my $status_url = 'http://localhost/server-status'; # URL to the server-status
my $look_for = 'httpd'; # Name of the apache executable (so we can filter out the result from top)


my $top_cmd = 'top -b -n1'; # The 'top' command that gives us a full list of the processes

my $displ_cmd = 'watch -n 1 "'. $0 ." -1 | column -ts \Q$'\t'\E\"";
my $displ_cmd2 = $0 ." -1 | column -ts \Q$'\t'\E";


##########################################
# COMMAND LINE & IMPLEMENTATION
##########################################
if ($#ARGV >= 0 && !(grep $_ == $ARGV[0], ('-1', '-2')))
{
print "Syntax: httop [-1]\n";
exit;
}
elsif ($ARGV[0] == '-2') # If we need to simply execut the column command
{
exec $displ_cmd2;
exit;
}
elsif ($#ARGV == -1) # No arguments, so run the main command
{
exec $displ_cmd;
exit;
}


#######################
# Fetching the data

use LWP::Simple 'get';


# Get the top data
# The reason we're getting this first is that it takes more time than the http request!
my $top = `$top_cmd`;


# Quickly fetch the server status
my $status = get $status_url;

# If we failed, just exit
if (!defined $status)
{
die "Couldn't fetch the server status from '$status_url'";
}


###########################
# Now let's map the data

my %processes = ();

while ($top =~ /^\s*(\S+)\s+(\S+)\s+(\S+)\s+(\S+)\s+(\S+)\s+(\S+)\s+(\S+)\s+(\S+)\s+(\S+)\s+(\S+)\s+(\S+)\s+(\S+)\s*$/gmsi)
{
next unless ($12 eq $look_for);

$pid = $1;

$processes{$pid} = {
'PID' => $1,
'USER' => $2,
'CPU' => $9,
'MEM' => $10,

# To be set later
'IP' => '',
'DOMAIN' => '',
'REQUEST' => '',
};

{
my $val = $9;
$val =~ s/,/./;

$processes{$pid}{val} = $val;
}
}


################################################################
# Merge the info we got from apache with what we got from top

while ($status =~ /<tr><td><b>([^<]+)<\/b><\/td><td>(\d+)<\/td><td>([^<]+)<\/td><td>(?:<b>)?([^<]+)(?:<\/b>)?\s*<\/td><td>([^<]+)<\/td><td>([^<]+)<\/td><td>([^<]+)<\/td><td>([^<]+)<\/td><td>([^<]+)<\/td><td>([^<]+)\s*<\/td><td>([^<]+)<\/td><td nowrap>([^<]+)<\/td><td nowrap>([^<]+)<\/td><\/tr>/g)
{
my $pid = $2;

if (defined $processes{$pid})
{
$processes{$pid}{IP} = $11;
$processes{$pid}{DOMAIN} = $12;
$processes{$pid}{REQUEST} = $13;
$processes{$pid}{REQUEST} =~ s/\t/\s/g;
}
}


print "PID\tUSER\t\%CPU\t\%MEM\tIP\tDOMAIN\tREQUEST\n";

my @keys = sort { $processes{$b}{val} <=> $processes{$a}{val} } keys %processes;
my @items = @processes{@keys};

foreach $item (@items)
{
print $item->{PID}, "\t";
print $item->{USER}, "\t";
print pad($item->{CPU}, 4), "\t";
print pad($item->{MEM}, 4), "\t";
print $item->{IP}, "\t";
print $item->{DOMAIN}, "\t";
print $item->{REQUEST}, "\n";
}


sub pad
{
return (' ' x ($_[1] - (length $_[0]))) . $_[0];
}
 
Hello,

no luck with the new FcgidMaxProcesses settings, this time the killer process starts at 3:40 almost.
In error.log file I can find
[Sun Dec 17 03:41:05 2017] [warn] [client 207.46.13.148] (32)Broken pipe: mod_fcgid: can't write spawn command
The log file have been rotated almost at 3:40.
This is the logged killer process as you can see any URI attached to this request:
PID USER %CPU %MEM IP DOMAIN REQUEST
1796 apache 100.0 0.2

Any suggestion?

Thank you,
Davide
 

Attachments

  • Cattura.PNG
    Cattura.PNG
    84.9 KB · Views: 5
  • Cattura2.PNG
    Cattura2.PNG
    48.7 KB · Views: 6
@hozone

There are some issues that you have to distinguish.

First, there is the

[Sun Dec 17 03:41:05 2017] [warn] [client 207.46.13.148] (32)Broken pipe: mod_fcgid: can't write spawn command

and that is the result of resource overusage, in this case it is very likely to be a lack of free CPU resources.

Second, there is another problem: the root cause of the problem.

This issue is actually causing the resource overusage.


In short, you have to be hunting for the root cause of the problem (and ignore the first problem for the time being).

You can also put some output from logs on the forum, which will allow us to have a better idea of what is actually happening.

Regards.....
 
Hello.

Yes, I'm trying to investigate the root cause, which I though it was FcgidMaxProcesses at first.

Errors just happened on sunday moring, it is a bit hard to investigate on that, I've never encounter that apparently strange behaviour before.

That is the error log before the 100% CPU happens
[Sun Dec 17 03:19:33 2017] [warn] [client 93.41.1.96] mod_fcgid: stderr: PHP Warning: array_merge(): Argument #2 is not an array in /var/www/vhosts/mydomain.com/httpdocs/classes/Product.php on line 5557, referer: https://www.mydomain.com/it/digitalthings
[Sun Dec 17 03:41:05 2017] [warn] [client 207.46.13.148] (32)Broken pipe: mod_fcgid: can't write spawn command

No particular things happened on the access and access ssl log before the 100% CPU happens, just some request from bot at that time, nothing fancy.
It is a bit strange the webstat log, I've disabled webstat for this domain.

All the process running and all apache and http request at the time of the httpd restart (6 oclock) here: ExpireBox | Desktop.zip

If further log is needed for invastigation just let me know.

Thank you for your help!
 
@hozone

What kind of program do you use: WP, Drupal, or what is it?

Moreover, you should upload the logs (as a zip) to this forum, the other files from expirebox are not very helpful.

Regards
 
Hello, it's me again.
I've found the origin of the issue... it's logrotate as I suspect.
I've managed to switch off the logrotate call in the daily crontab, and the issu does not happens anymore.
if i comment out the logrotate part on the daily crontab, problem goes away.. of course it came back when I enable the logrotate.

Do you have any suggestion to catch why logrotate is killing my CPU?

Thank you.
 
Thank you,
that files was not so big for me.. but I've made the resolutions step.
I'll let you know if it works!
 
Back
Top