plesk has a built-in health monitoring which lets you configure alarm thresholds for automatic notification. most of these thresholds are percentage-based to flag a notification if memory or cpu usage gets too high.
i'm having trouble determining how these percentages are measured. measuring for memory is easy (we're dealing with a fixed figure here) but cpu usage is more complicated on multi-proc servers.
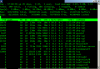
CPU Info:
Architecture: x86_64
CPU op-mode(s): 32-bit, 64-bit
Byte Order: Little Endian
CPU(s): 8
On-line CPU(s) list: 0-7
Thread(s) per core: 2
Core(s) per socket: 4
Socket(s): 1
NUMA node(s): 1
Vendor ID: GenuineIntel
CPU family: 6
Model: 42
Stepping: 7
CPU MHz: 1600.000
BogoMIPS: 6784.52
Virtualization: VT-x
L1d cache: 32K
L1i cache: 32K
L2 cache: 256K
L3 cache: 8192K
NUMA node0 CPU(s): 0-7
Now am i right in thinking, that if a single core hits the 90% then this would trigger the Alarm on the Health Monitoring?
Most of my Flags are from 80% = Yellow to 90% = Red
And its pretty much always on Red, I believe this is because its Multi Core and the health tool is working on a single core.
if i use the command TOP with Shift and I
Then i get the overall CPU process, and its nothing along the lines as to what the health monitor is showing me the total % is.
I dont know if i have picked up false information or been miss guided, But maybe someone can help steer me in the right direction, or shine a little light on it at least
")
Thanks
i'm having trouble determining how these percentages are measured. measuring for memory is easy (we're dealing with a fixed figure here) but cpu usage is more complicated on multi-proc servers.
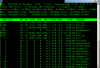
CPU Info:
Architecture: x86_64
CPU op-mode(s): 32-bit, 64-bit
Byte Order: Little Endian
CPU(s): 8
On-line CPU(s) list: 0-7
Thread(s) per core: 2
Core(s) per socket: 4
Socket(s): 1
NUMA node(s): 1
Vendor ID: GenuineIntel
CPU family: 6
Model: 42
Stepping: 7
CPU MHz: 1600.000
BogoMIPS: 6784.52
Virtualization: VT-x
L1d cache: 32K
L1i cache: 32K
L2 cache: 256K
L3 cache: 8192K
NUMA node0 CPU(s): 0-7
Now am i right in thinking, that if a single core hits the 90% then this would trigger the Alarm on the Health Monitoring?
Most of my Flags are from 80% = Yellow to 90% = Red
And its pretty much always on Red, I believe this is because its Multi Core and the health tool is working on a single core.
if i use the command TOP with Shift and I
Then i get the overall CPU process, and its nothing along the lines as to what the health monitor is showing me the total % is.
I dont know if i have picked up false information or been miss guided, But maybe someone can help steer me in the right direction, or shine a little light on it at least
Thanks