• The new Python extension is now available. It allows customers to deploy and manage WSGI-based Python applications on their websites directly from Plesk.
  • The Plesk Mobile apps for iOS and Android and the Plesk Mobile Center extension have been deprecated, and are no longer available for new installations. In Plesk Obsidian 18.0.84, the Plesk Mobile Center extension will be removed from servers during the upgrade, and the Plesk Mobile apps will lose their server management features.
  • The Social Login extension has been deprecated and will be removed in Plesk Obsidian 18.0.84. After that, it will no longer be possible to log in to Plesk with a Google, Facebook, GitHub account, or with a passkey. Plesk usernames and passwords, as well as logging in with a WebPros Account, are not affected.

Question How to find what domain is taking all the resources

mb_martijn

New Pleskian
Server operating system version
Almalinux 9.8
Plesk version and microupdate number
Plesk Obsidian v18.0.81
We have issues with CPU spikes that cause the sites to be unreachable on one of our server with 27 websites hosted on it. (Plesk Obsidian v18 + Almalinux 9.8).
The spikes happen on all hours of the day, on irregular intervals ranging from a few days in between to a couple of hours. We have not had any major changes in domains or websites before or since this started to happen - it went ok for a year without any problems before.
And we have a hard time pin-pointing the source.
What can we do to find out what domain is causing this?
 
There is a myriad of ways you can go about this. From my own experience high CPU loads are often directly related to a high volume of traffic. Going trough the access logs (seeing which access log has the largest files size) should give you some details already. GoAccess (or your favorite AI tool) can help you analyze those logs.

However, if you want/need more specific details, a running a tool like atop can be useful to record resource usage for a while. (Logs can grow rather quicly, so be mindful).

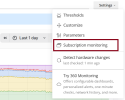
Alternatively, If you have Cgroups enabled and use the build-in monitoring (with Grafana), you monitor resources usage from subscriptions. There is a maximum of 10 subscriptions you can add to monitor unfortunately.
Screenshot 2026-10-21 101346.png

Hope this helps.
 
Back
Top