• If you are still using CentOS 7.9, it's time to convert to Alma 8 with the free centos2alma tool by Plesk or Plesk Migrator. Please let us know your experiences or concerns in this thread:
    CentOS2Alma discussion

Question How to understand why server went down?

PeopleInside

Regular Pleskian
Server operating system version
Ubuntu 22.04.2 LTS
Plesk version and microupdate number
Plesk Obsidian Version 18.0.51
Ubuntu 22.04.2 LTS
Plesk Obsidian
Version 18.0.51 Update #1, last updated on April 6, 2023 06:27 AM
---
Is two days that my VPS went down.
I need log in in my hosting provider website and restart the VPS.

From the hosting monitors I can see the CPU and the RAM never reach 100% so I don't think is an issue of resources.
My VPS is 6 vCore RAM: 8 GB SSD: 160 GB
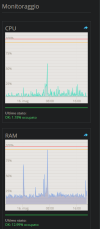
1684256228486.png

The hosting provider may reply to me that the server is unmanaged from they, is managed by me so they don't have info about the downtime and I need check logs.
Any idea on where I can look to understand why my website goes down?
Any way to understand in Plesk what is happening?

Thank you!
 
Hi,

Ubuntu logs every system message to /var/log/syslog. If you look at that file, you can find out what happened with your server. Look at the date/time in the syslog corresponding to the date/time your server went down.

Here are a few questions to understand your problem a little better:
  • Is your server down for two days in a row? Or did it happen two days ago, and is the server back up again?
  • Do you have a monitoring service like UptimeRobot (check Google) that warns you when the server is unreachable?
  • When the server was down, did you try to reach it using another network (mobile)? It occasionally happens that fail2ban blocks your IP address, making you think the server is down.
  • Is the server's IP address whitelisted in Fail2ban "Trusted IP Addresses"? Fail2ban sometimes blocks the server's IP address, making the server unreachable.
 
Last edited:
Ubuntu logs every system message to /var/log/syslog. If you look at that file, you can find out what happened with your server. Look at the date/time in the syslog corresponding to the date/time your server went down.
Today at 18:07 my server went down for 27 minutes (until I never restart manually)
If I look into the logs I see nothing, I see logs continue also after 18:07.

The downtime start at 18:07 and ends at 18:34 after my manual reboot from the hosting VPS website.
Logs stille xist in this lass of time so from logs looks server was working normally.

I see this log:

Code:
May 16 18:05:45 peo named[976]: no longer listening on (MY VPS IP)#53
May 16 18:06:05 peo plesk_saslauthd[97254]: select timeout, exiting

I don't know if this means something.
At 18:32 I can see ome logs that seems after my request to restart the server, logs that stop service and restart later.

Is your server down for two days in a row? Or did it happen two days ago, and is the server back up again?
1684267846364.png
The only normal downtime is the day 16 at 6:05 where the tool icon is showed this was done for maintenance.
All other downtime are not normal.

As you can see not two day of downtime because after I get the notification email from the uptime monitor, as soon as I'm at the PC I restarted the server and then went up again. This happened yesterday 15 may and today at 18:07 again downtime and needs to restart server manually.

Do you have a monitoring service like UptimeRobot (check Google) that warns you when the server is unreachable?
Yes, link above

When the server was down, did you try to reach it using another network (mobile)? It occasionally happens that fail2ban blocks your IP address, making you think the server is down.
Was down for me and for the uptime check service
Is the server's IP address whitelisted in Fail2ban "Trusted IP Addresses"? Fail2ban sometimes blocks the server's IP address, making the server unreachable.
Checked and it is

Thank you!
 
If you are using an IONOS VPS, then I've found this thread that looks like the issue you're having:

 
If you are using an IONOS VPS, then I've found this thread that looks like the issue you're having:

Yes, I'm using IONOS.
From the thread seems the issue has not really been resolved.

I'm on IONOS since long time and in a more then a year this issue happen sometimes, no to often so I'm asking why happen only sometimes.
Maybe I had two day of downtime and now for another few mount I will never have down then again... downtime.

In the /etc/network I have not the file interfaces
1684315140114.png
 
I get also this error this morning:
Code:
Some problems occurred with the System Updates tool on your server peopleinside.it. Please resolve them manually.

Reason: 2023-05-17 06:26:30 INFO: pum is called with arguments: ['--list', '--repo-info', '--json']
2023-05-17 06:26:31 ERROR: Failed to lock directory /var/lib/apt/lists/: E:Could not get lock /var/lib/apt/lists/lock. It is held by process 74608 (apt-get)
2023-05-17 06:26:31 ERROR: Exited with returncode 1.
 
I tried to ask to the team a sort out about this issue.

Seems I'm not the only one that has this issue and this is happening also on more powerful server with 32 GB of RAM so is not a resource server issue.

Any suggestion to how I can create a script that check if named service stop to listening and restart the service will be appreciated, this can be the only automatism that save me.

I don't see any other fix currently.
I have external DNS at CloudFlare but seems if this service stop my email and web server stop to work as well.
 
Passenger is used to run Node.js applications on Plesk. It's part of the Node.js extension:


You should probably remove the Node.js extension if you don't run Node.js applications.

By the way: the memory print looks fine. No issues there.
 
Back
Top