• Please be aware: Kaspersky Anti-Virus has been deprecated
    With the upgrade to Plesk Obsidian 18.0.64, "Kaspersky Anti-Virus for Servers" will be automatically removed from the servers it is installed on. We recommend that you migrate to Sophos Anti-Virus for Servers.
  • The Horde webmail has been deprecated. Its complete removal is scheduled for April 2025. For details and recommended actions, see the Feature and Deprecation Plan.
  • We’re working on enhancing the Monitoring feature in Plesk, and we could really use your expertise! If you’re open to sharing your experiences with server and website monitoring or providing feedback, we’d love to have a one-hour online meeting with you.

Question Low memory usage (my.cnf)

yigitvp

New Pleskian
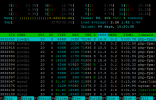
Im trying to find the best settings for "my.cnf". However, the memory usage is very low, as if not implemented. Can you help
Code:
#
# This group is read both both by the client and the server
# use it for options that affect everything
#
[client-server]

#
# include all files from the config directory
#
!includedir /etc/my.cnf.d

[mysqld]
sql_mode=ERROR_FOR_DIVISION_BY_ZERO,NO_AUTO_CREATE_USER,NO_ENGINE_SUBSTITUTION
bind-address = ::ffff:127.0.0.1
local-infile=0

innodb_buffer_pool_size=24G
query_cache_size=400M
max_connections=600
innodb_log_buffer_size=512M
key_buffer_size=1000M
read_buffer_size=1M
join_buffer_size=1M
innodb_flush_method=O_DIRECT

htop3.PNG

Mariadb 10.3.28
Centos 8 + Plesk/Nginx
AMD Ryzen™ 5 3600
64 GB DDR4
2 x 512 GB NVMe SSD

note: I have tried restarting mysql and mariadb.
 
Last edited:
There is no such thing as "the best settings" for MariaDB as the settings heavily depend on the kind of databases, queries and applications you are going to run on your server.

MariaDB/MySQL tuning is a complex topic that requires quite a bit of knowledge about your databases, queries and applications.

You should start first with default MariaDB settings, without changing anything. Then let your applications run for a while and check the performance and response times.
Do you experience any slowness or errors?
If not: Don't touch anything.
If yes: Analyse the problem. Tools such as mysqltuner can be quite handy for this. And before changing any parameters in my.cnf (or my.cnf.d/*) read the description and recommendations at mariadb.org regarding the parameter. After that, apply your changes one by one and wait 1-2 days inbetween to see if they actually improve the situation.

A good starting point is: MariaDB Performance Tuning
Also: How to troubleshoot slow performance of MySQL on a Plesk server?
There is no change in memory usage even though I have entered very high and extreme values.
In the default settings, the server sees 3-4 load values in the evening. I am adjusting it because the ram usage is very low.
It seems absurd that the memory usage has not changed.
 
In a cursory glance, I'll that that in general innodb_log_file_size should be 25% of the inndb_buffer_pool_size. Did you take a look at the actual status of MariaDB itself?
 
-------- Recommendations ------------------------------------------------------- --------------------
General recommendations:
Control warning line(s) into /var/log/mariadb/mariadb.log file
Control error line(s) into /var/log/mariadb/mariadb.log file
Restrict Host for '***_wp498'@% to '***_wp498'@LimitedIPRangeOrLoc alhost
RENAME USER '***_wp498'@'%' TO '***_wp498'@LimitedIPRangeOrLocalho st;
MySQL was started within the last 24 hours - recommendations may be inaccura te
Configure your accounts with ip or subnets only, then update your configurat ion with skip-name-resolve=1
We will suggest raising the 'join_buffer_size' until JOINs not using indexes are found.
See MySQL :: MySQL Internals Manual :: 10.5 How MySQL Uses the Join Buffer Cache
(specially the conclusions at the bottom of the page).
When making adjustments, make tmp_table_size/max_heap_table_size equal
Reduce your SELECT DISTINCT queries which have no LIMIT clause
Performance schema should be activated for better diagnostics
Consider installing Sys schema from mysql/mysql-sys for M ySQL
Consider installing Sys schema from FromDual/mariadb-sys for MariaDB
Before changing innodb_log_file_size and/or innodb_log_files_in_group read t his: MySQL :: MySQL 8.0 Reference Manual :: 15.6.5 Redo Log
Variables to adjust:
join_buffer_size (> 256.0K, or always use indexes with JOINs)
tmp_table_size (> 16M)
max_heap_table_size (> 16M)
table_definition_cache(400) > 483 or -1 (autosizing if supported)
performance_schema = ON enable PFS
innodb_log_file_size should be (=16M) if possible, so InnoDB total log files size equals to 25% of buffer pool size.
 
Last edited:
Be careful when changing the innodb_log_file_size parameter, it needs to be done carefully: How to change the innodb_log_file_size value in MySQL/MariaDB
my.cnf:
#
# This group is read both both by the client and the server
# use it for options that affect everything
#
[client-server]

#
# include all files from the config directory
#
!includedir /etc/my.cnf.d

[mysqld]
sql_mode=ERROR_FOR_DIVISION_BY_ZERO,NO_AUTO_CREATE_USER,NO_ENGINE_SUBSTITUTION
bind-address = ::ffff:127.0.0.1
local-infile=0

query_cache_size=0
query_cache_type=0
tmp_table_size=16M
max_heap_table_size=16M
performance_schema=ON
innodb_log_buffer_size=3G

ssh:
mv /var/lib/mysql/ib_log* /root

After doing this the ram user increased from 3gb to 8gb
The cpu usage has not decreased as much as I thought, I'm probably doing my.cnf wrong :confused:
Its good to see change though.
edit: ı restarted mysql. ram 2gb ...
I think I need someone to give me the setting text. I do not have enough information :(
 
Last edited:
Variables to adjust:
join_buffer_size (> 256.0K, or always use indexes with JOINs)
tmp_table_size (> 16M)
max_heap_table_size (> 16M)
table_definition_cache(400) > 483 or -1 (autosizing if supported)
performance_schema = ON enable PFS
innodb_log_file_size should be (=16M) if possible, so InnoDB total log files size equals to 25% of buffer pool size.
It seems that your changes aren't used - what does mysqltuner say in section InnoDB Metrics?
When it says join_buffer_size (> 256.0K that means the currently used value is 256K, but you had set it to 1M in my.cnf.
 
MariaDB only uses what memory js needed, regardless of what you set innodb buffer pool too. If you only have 1 GB of data, 24GB is useless and won't ever be used.
 
It seems that your changes aren't used - what does mysqltuner say in section InnoDB Metrics?
When it says join_buffer_size (> 256.0K that means the currently used value is 256K, but you had set it to 1M in my.cnf.
Tested with nothing in my.cnf file.
full document:

Code:
 >>  MySQLTuner 1.7.25 - Major Hayden <[email protected]>
 >>  Bug reports, feature requests, and downloads at http://mysqltuner.pl/
 >>  Run with '--help' for additional options and output filtering

[--] Skipped version check for MySQLTuner script
[OK] Currently running supported MySQL version 10.3.28-MariaDB
[OK] Operating on 64-bit architecture

-------- Log file Recommendations ------------------------------------------------------------------
[OK] Log file /var/log/mariadb/mariadb.log exists
[--] Log file: /var/log/mariadb/mariadb.log(90K)
[OK] Log file /var/log/mariadb/mariadb.log is not empty
[OK] Log file /var/log/mariadb/mariadb.log is smaller than 32 Mb
[OK] Log file /var/log/mariadb/mariadb.log is readable.
[!!] /var/log/mariadb/mariadb.log contains 40 warning(s).
[!!] /var/log/mariadb/mariadb.log contains 79 error(s).
[--] 27 start(s) detected in /var/log/mariadb/mariadb.log
[--] 1) 2021-05-20 19:00:01 0 [Note] /usr/libexec/mysqld: ready for connections.
[--] 2) 2021-05-20 18:46:53 0 [Note] /usr/libexec/mysqld: ready for connections.
[--] 3) 2021-05-20 18:46:45 0 [Note] /usr/libexec/mysqld: ready for connections.
[--] 4) 2021-05-20 18:40:58 0 [Note] /usr/libexec/mysqld: ready for connections.
[--] 5) 2021-05-20 18:39:23 0 [Note] /usr/libexec/mysqld: ready for connections.
[--] 6) 2021-05-20 18:26:42 0 [Note] /usr/libexec/mysqld: ready for connections.
[--] 7) 2021-05-20 18:24:49 0 [Note] /usr/libexec/mysqld: ready for connections.
[--] 8) 2021-05-20 18:20:16 0 [Note] /usr/libexec/mysqld: ready for connections.
[--] 9) 2021-05-20 17:43:48 0 [Note] /usr/libexec/mysqld: ready for connections.
[--] 10) 2021-05-20 17:41:17 0 [Note] /usr/libexec/mysqld: ready for connections.
[--] 27 shutdown(s) detected in /var/log/mariadb/mariadb.log
[--] 1) 2021-05-20 18:58:46 0 [Note] /usr/libexec/mysqld: Shutdown complete
[--] 2) 2021-05-20 18:46:53 0 [Note] /usr/libexec/mysqld: Shutdown complete
[--] 3) 2021-05-20 18:46:45 0 [Note] /usr/libexec/mysqld: Shutdown complete
[--] 4) 2021-05-20 18:40:58 0 [Note] /usr/libexec/mysqld: Shutdown complete
[--] 5) 2021-05-20 18:39:22 0 [Note] /usr/libexec/mysqld: Shutdown complete
[--] 6) 2021-05-20 18:26:41 0 [Note] /usr/libexec/mysqld: Shutdown complete
[--] 7) 2021-05-20 18:24:49 0 [Note] /usr/libexec/mysqld: Shutdown complete
[--] 8) 2021-05-20 18:20:16 0 [Note] /usr/libexec/mysqld: Shutdown complete
[--] 9) 2021-05-20 17:43:48 0 [Note] /usr/libexec/mysqld: Shutdown complete
[--] 10) 2021-05-20 17:41:16 0 [Note] /usr/libexec/mysqld: Shutdown complete

-------- Storage Engine Statistics -----------------------------------------------------------------
[--] Status: +ARCHIVE +Aria +BLACKHOLE +CSV +FEDERATED +InnoDB +MEMORY +MRG_MyISAM +MyISAM +PERFORMANCE_SCHEMA +SEQUENCE
[--] Data in MyISAM tables: 113.8M (Tables: 19)
[--] Data in InnoDB tables: 45.8M (Tables: 305)
[OK] Total fragmented tables: 0

-------- Analysis Performance Metrics --------------------------------------------------------------
[--] innodb_stats_on_metadata: OFF
[OK] No stat updates during querying INFORMATION_SCHEMA.

-------- Security Recommendations ------------------------------------------------------------------
[OK] There are no anonymous accounts for any database users
[OK] All database users have passwords assigned
[!!] User '***_wp498'@%' does not specify hostname restrictions.
[--] There are 620 basic passwords in the list.

-------- CVE Security Recommendations --------------------------------------------------------------
[OK] NO SECURITY CVE FOUND FOR YOUR VERSION

-------- Performance Metrics -----------------------------------------------------------------------
[--] Up for: 51m 36s (3M q [1K qps], 37K conn, TX: 30G, RX: 376M)
[--] Reads / Writes: 95% / 5%
[--] Binary logging is disabled
[--] Physical Memory     : 62.6G
[--] Max MySQL memory    : 3.2G
[--] Other process memory: 0B
[--] Total buffers: 417.0M global + 18.9M per thread (151 max threads)
[--] P_S Max memory usage: 0B
[--] Galera GCache Max memory usage: 0B
[OK] Maximum reached memory usage: 681.7M (1.06% of installed RAM)
[OK] Maximum possible memory usage: 3.2G (5.11% of installed RAM)
[OK] Overall possible memory usage with other process is compatible with memory available
[OK] Slow queries: 0% (0/3M)
[OK] Highest usage of available connections: 9% (14/151)
[OK] Aborted connections: 0.00%  (0/37050)
[!!] name resolution is active : a reverse name resolution is made for each new connection and can reduce performance
[OK] Query cache is disabled by default due to mutex contention on multiprocessor machines.
[OK] Sorts requiring temporary tables: 0% (0 temp sorts / 717K sorts)
[!!] Joins performed without indexes: 557
[!!] Temporary tables created on disk: 73% (98K on disk / 134K total)
[OK] Thread cache hit rate: 99% (14 created / 37K connections)
[OK] Table cache hit rate: 92% (192 open / 207 opened)
[!!] table_definition_cache(400) is lower than number of tables(483)
[OK] Open file limit used: 0% (105/32K)
[OK] Table locks acquired immediately: 99% (3M immediate / 3M locks)

-------- Performance schema ------------------------------------------------------------------------
[--] Performance schema is disabled.
[--] Memory used by P_S: 0B
[--] Sys schema isn't installed.

-------- ThreadPool Metrics ------------------------------------------------------------------------
[--] ThreadPool stat is enabled.
[--] Thread Pool Size: 12 thread(s).
[--] Using default value is good enough for your version (10.3.28-MariaDB)

-------- MyISAM Metrics ----------------------------------------------------------------------------
[!!] Key buffer used: 37.9% (50M used / 134M cache)
[OK] Key buffer size / total MyISAM indexes: 128.0M/25.4M
[OK] Read Key buffer hit rate: 99.9% (57M cached / 47K reads)
[OK] Write Key buffer hit rate: 99.8% (1K cached / 1K writes)

-------- InnoDB Metrics ----------------------------------------------------------------------------
[--] InnoDB is enabled.
[--] InnoDB Thread Concurrency: 0
[OK] InnoDB File per table is activated
[OK] InnoDB buffer pool / data size: 128.0M/45.8M
[!!] Ratio InnoDB log file size / InnoDB Buffer pool size (75 %): 48.0M * 2/128.0M should be equal to 25%
[OK] InnoDB buffer pool instances: 1
[--] Number of InnoDB Buffer Pool Chunk : 1 for 1 Buffer Pool Instance(s)
[OK] Innodb_buffer_pool_size aligned with Innodb_buffer_pool_chunk_size & Innodb_buffer_pool_instances
[OK] InnoDB Read buffer efficiency: 99.93% (3813911 hits/ 3816447 total)
[!!] InnoDB Write Log efficiency: 10.2% (25 hits/ 245 total)
[OK] InnoDB log waits: 0.00% (0 waits / 220 writes)

-------- Aria Metrics ------------------------------------------------------------------------------
[--] Aria Storage Engine is enabled.
[OK] Aria pagecache size / total Aria indexes: 128.0M/0B
[OK] Aria pagecache hit rate: 97.2% (3M cached / 98K reads)

-------- TokuDB Metrics ----------------------------------------------------------------------------
[--] TokuDB is disabled.

-------- XtraDB Metrics ----------------------------------------------------------------------------
[--] XtraDB is disabled.

-------- Galera Metrics ----------------------------------------------------------------------------
[--] Galera is disabled.

-------- Replication Metrics -----------------------------------------------------------------------
[--] Galera Synchronous replication: NO
[--] No replication slave(s) for this server.
[--] Binlog format: MIXED
[--] XA support enabled: ON
[--] Semi synchronous replication Master: OFF
[--] Semi synchronous replication Slave: OFF
[--] This is a standalone server

-------- Recommendations ---------------------------------------------------------------------------
General recommendations:
    Control warning line(s) into /var/log/mariadb/mariadb.log file
    Control error line(s) into /var/log/mariadb/mariadb.log file
    Restrict Host for '***_wp498'@% to '***_wp498'@LimitedIPRangeOrLocalhost
    RENAME USER '***_wp498'@'%' TO '***_wp498'@LimitedIPRangeOrLocalhost;
    MySQL was started within the last 24 hours - recommendations may be inaccurate
    Configure your accounts with ip or subnets only, then update your configuration with skip-name-resolve=1
    We will suggest raising the 'join_buffer_size' until JOINs not using indexes are found.
             See https://dev.mysql.com/doc/internals/en/join-buffer-size.html
             (specially the conclusions at the bottom of the page).
    When making adjustments, make tmp_table_size/max_heap_table_size equal
    Reduce your SELECT DISTINCT queries which have no LIMIT clause
    Performance schema should be activated for better diagnostics
    Consider installing Sys schema from https://github.com/mysql/mysql-sys for MySQL
    Consider installing Sys schema from https://github.com/FromDual/mariadb-sys for MariaDB
    Before changing innodb_log_file_size and/or innodb_log_files_in_group read this: https://bit.ly/2TcGgtU
Variables to adjust:
    join_buffer_size (> 256.0K, or always use indexes with JOINs)
    tmp_table_size (> 16M)
    max_heap_table_size (> 16M)
    table_definition_cache(400) > 483 or -1 (autosizing if supported)
    performance_schema = ON enable PFS
    innodb_log_file_size should be (=16M) if possible, so InnoDB total log files size equals to 25% of buffer pool size.

What do you think should I do to get the most out of memory?
 
Is there a performance issue or resource bottleneck you're trying to address?

To restate my comment, it doesn't matter how much memory you have or give MySQL if you only have X amount of data....
 
Is there a performance issue or resource bottleneck you're trying to address?

To restate my comment, it doesn't matter how much memory you have or give MySQL if you only have X amount of data....
I want to reduce the CPU usage a little more. I made such a comment because the memory usage was low. My site has 600-900 online visitors.
 
MySQL will always use CPU. Even if you store everything in memory.

I'd look into page caching and/or something like Redis/Memcache
 
MySQL will always use CPU. Even if you store everything in memory.

I'd look into page caching and/or something like Redis/Memcache
I am already using cache. I looked for a good install text in memcached php 7.4 but couldn't find it. I tried something but it increased the cpu usage.
Is there anything you can suggest for a beginner?
I could not get around much because Plesk does not support it.
 
Note: memcached/object caching doesn't always help or make your site faster.
I installed it and confirmed it.
Later,
I tried this and it caused 500 error on the site.
I think I have an incompatible site for memcached
 
Your db is smol.
Size-wise there is not much to do.
Maybe experiment with the query cache (some systems profit from it despite the mutex problem).
And improve your queries so that your JOINs use indexes.
query_cache_size=128M
query_cache_limit=4M
Is that the example? I did not fully understand what you said. .o
 
Back
Top