• Plesk Uservoice will be deprecated by October. Moving forward, all product feature requests and improvement suggestions will be managed through our new platform Plesk Productboard.
    To continue sharing your ideas and feedback, please visit features.plesk.com

Question Memory usage after backup

rilCy

New Pleskian
Hello,

I would like to request your help regarding memory usage, could not find any relevant things about what i encounter.

I recently did some performance tuning on MySQL in order to lower its memory usage

Server specifications :

OS : Debian 9.13
Plesk version : Plesk Obsidian Version 18.0.30 Update #3
RAM : 16 Go
CPU : 8
Disk : 512 Go ( HDD )
FS : XFS

Here is the list of what i tuned :

General stuff

INI:
[mysqld]
max_connections = 100
key_buffer_size = 1G
query_cache_size = 64M
table_cache = 16384
max_heap_table_size = 128M
tmp_table_size = 128M
open_files_limit = 32768

InnoDB specific

INI:
[mysqld]
innodb_io_capacity = 2000
innodb_read_io_threads = 64
innodb_write_io_threads = 64
innodb_thread_concurrency = 0
innodb_buffer_pool_size    = 4GB
innodb_log_file_size = 1GB

After i pushed these values and restarted MySQL i was really happy because i could see a huge memory usage improvement (event after a few hours MySQL has restarted)

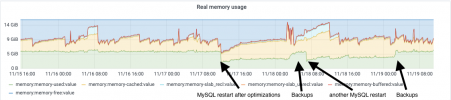
But, i noticed that the daily backups that occurs during the night ( 2:30 in my case ) are reclaiming a lot of memory which is completely normal, unfortunately even after the backups are done i can see on the grafs that the memory is not released, it just keep at the same level as it was during the backups (i mean the memory_used metric).

Is it normal ? Shouldn't the system reclaim that memory once backups are done ? I mean it's not in the cached part as some posts suggest.
I attached a screenshot from the Real memory usage graf with details, we can see that after the last backup the memory usage keep high.

( Hopefully, those MySQL optimizations have permitted to lower the swap usage (second screenshot) but still i was expecting to gain on memory_used )

Thank you in advance for your advices / help

Cheers
 

Attachments

  • screenshot 2020-11-19 à 11.07.38.png
    screenshot 2020-11-19 à 11.07.38.png
    90.3 KB · Views: 19
  • screenshot 2020-11-19 à 11.13.06.png
    screenshot 2020-11-19 à 11.13.06.png
    105.7 KB · Views: 20
Hello
I m observing quite the same phenomena, but not exactly after searching around MySQL (mariadb) I found that the cached memory was still high... and that affects the general hosting perfomances... finally the best I found is rebooting the server after the backup, this is not clean but the best result for the performance.... is anybody having a better solution ? What process make this memory use and cache that is not necessary and at all not emptyied when necessary ?
What did you do on your server ? for now ?
 
cached memory was still high... and that affects the general hosting perfomances...
No way.

finally the best I found is rebooting the server after the backup, this is not clean but the best result for the performance.... is anybody having a better solution ?
Do nothing, just let the system decide what is best.

Cache and other RAM usage is automatically cleared if a process requests RAM that cannot be served from parts that are not yet in use. It is the normal way of Linux to manage RAM.
 
Indeed. A backup does a SQL dump, which is basically a full read of the database, so some caches will be used in MySQL. That's normal, expected, and as Peter mentioned, just let the systems manage memory unless you're getting errors or issues. High cached memory usage won't result in lower performance unless it means something else doesn't get cached.
 
@weltonw @MaartenVerbeek @Bitpalast
We are seeing this exact same problem and it does result in a crash caused by memory allocation issues.
Can I ask for your comment on the post I have shared below:

 
Please describe "memory allocation issues" in more detail. What exactly is happening?
Because this is a critical state and causes a £2m a year website to become inaccessible - I cannot force this to recreate.

Essentially if we dont restart mariaDB every 48-72 hours (We are doing every 24 hours right now to ensure no issues) - Mariadb + System consumes ALL available ram, even with the buffer pool set to only 25% of the total server.

When this critical point is met, if the client's website gets a small surge in traffic then the PHP FPM doesnt have enough memory to function. Causing a bottleneck and then mariaDB to crash.

It attempts to kill some processes but the memory never gets released. Then MariaDB crashes - Which we have to restart from repair kit.

We have dedicated Linux support and even they have not been able to solve this.

Hence reaching out. I was suprised to see the user on this post has the exact same issue looking at the screenshots.
 
The database is fine. You'll need to find out why your website (the webserver, hence PHP-FPM processes) request so much RAM. In general, a "£2m a year website" seems to deserve a proper RAM size anyway. But what's really happening is that your site is getting hit by persumably a lot of real traffic or a lot of bad bots. The web server runs out of RAM, the system does, but not the database. Look at your webserver and PHP processes instead.
 
The database is fine. You'll need to find out why your website (the webserver, hence PHP-FPM processes) request so much RAM. In general, a "£2m a year website" seems to deserve a proper RAM size anyway. But what's really happening is that your site is getting hit by persumably a lot of real traffic or a lot of bad bots. The web server runs out of RAM, the system does, but not the database. Look at your webserver and PHP processes instead.
We've done a lot of work on this - The PHP FPM processes are stable and consistently under 5gb but if we get a spike due to an increase in traffic to lets say 12 gb to a specific page then the memory doesnt flush to accomodate this spike.

The problem is the mariadb/mysql memory is not managing itself properly - Therefore the phpfpm processes dont have enough ram to run?

Not the other way around?

Just to clarify here - When you say "proper ram size anyway" what are you suggesting? That we dont have enough ram? We were getting the same problem on our 128gb ram server before we moved to enterprise based on usage. Something fills the memory and then mysql doesnt release it. Ever.
 
You said, MySQL only accounts for 25% of the RAM (10 GB). So what is the real situation? Are you saying that MySQL occupies all available RAM? Can you prove this, e.g. with a monitoring chart?
 
yes indeed.

Let me go back to one of the crash situations:

Chart showing the 25th-27th August

  1. Each purge in data is a mariadb crash caused when the memory hits a critical point vs phpfpm requests
  2. OR
  3. me clearing the memory as we worked with our hosting provider to adjust the settings
  4. The innodb buffer WAS 22gb based on mysql tuners recommendation - but looking at the table sizes it didnt make sense to make the buffer this large given that phpfpm is getting suffocated
  5. We reduced the innodb buffer to 10gb based on the idea that it is still 4-5 times larger than the biggest table in the database.
  6. I dont have a screenshot of the process list but essentially - mariadb climbs gradually and approx 90% of total ram usage and the other 10% is system. Therefore no memory for phpfpm requests. They then back up and the DB falls over.
  7. This is at least what I think is happening. Each crash occurs during a period of high traffic on the website.
  8. The biggest issue is because it appears to be an allocation issue - the actual physical ram usage is NOT maxed out as you can see in the charts. Therefore our server autoscaling doesnt kick in
  9. Therefore A majority of the ram is shown as cache value

1757502860171.png
1757502917811.png
1757502969655.png
1757503005850.png
1757503022808.png
 
None of the charts shows that RAM is maxed out.
The maximum that your MySQL is using are approx. 18 GB. But you said your server has 40 GB.
The real memory usage is ordinary. Nothing special to see there. There is no RAM issue.
The CPU usage is at around 100% at the times when PHP and Apache usage show peaks.
--> The problem is the traffic of the website.

When you say "MySQL crashes", how do you know? When MariaDB crashes it logs details on the crash to /var/log/messages (or you can see them with journctl -u mariadb). Could you please post the log excerpt that shows the crash situation?

I'd also still recommend to rather check the website logs for bad bot traffic.
 
We've been through this process. Bad bots have been blocked but this has been going on for an extremely long time. Our old plesk server with 128gb of ram would have the same problem eventually. Its 100% not caused by Bot traffic.

On my other post referenced in my reply someone has suggested changing the memory allocator to jemalloc which should more efficiently purge memory when a task is complete. I am starting to think this is the root cause of our problem.

I know the db crashes because the website goes down and I have to restart mariadb because it has crashed. I cannot log in to plesk without running the repair kit or going in via SSH and restating mariadb.

When I look at the process list Mysql is consuming far more than it shows on these charts. Its not releasing the ram - its caching things making up the total of 100% used when combined with system use.

These figures: (Obviously in a healthy state right now because we restart mariadb at 3am every day to free up the memory)

In the crash situation the total ram usage is 100% comprising of 90% system and 10% domains 0% free.

Then mariadb is showing as being 80-90% of the total used by system.

It is strangling the rest of the server processes


1757504578568.png
 
For MariaDB your charts just don't show that it's occupying too much RAM. It's perfectly alright that it uses a few more GB than what the InnoDB cache got. In an overload situation, when the website gets many hits, naturally the process number against MariaDB also increases.

The reason why on a 128 GB machine the same problem exists makes sense, too. For unwanted traffic or website behavior, there is no upper limit. It is absolutely possible that a website creates so many PHP processes or consumes more and more RAM with runaway website processes that it quickly occupies all RAM. You can try to limit httpd's RAM usage to make sure it cannot grab so much that other services are left with nothing. For example limit it to 12 GB max RAM usage:

systemctl set-property httpd MemoryAccounting=true
systemctl set-property httpd MemoryLimit=12G

Verify the setting:
systemctl show httpd | grep MemoryLimit

After the changes:
systemctl daemon-reload
systemctl restart httpd
 
This is exactly my point - The memory is getting allocated which can be seen in the graphs and the process list during a spike but its all cache value allocated to mariadb which is getting locked and not cleared.

Its the memory not being released that is the issue. Restarting mariadb releases the memory and keeps everything running smoothly.

If I limit the memory use what happens if it hits the limit?
 
If you limit Apache RAM usage, Apache will not be able to spawn new child processes once it reaches the limit. It will also not be able to process new web requests until some RAM is freed again. However, for Apache this will happen quickly. Surfers will notice that they cannot reach the website, but once the spike is over, it should work again. But again: Normally the situation is that too many Apache processes are spawned, and once they reach a number higher 160, things logarithmically slow down, so it might take a longer while for Apache to recover. And I still suspect that it's about such processes.

For MariaDB limiting available RAM might indeed crash MariaDB. So far you have not shown the crash situation from journactl -u mariadb where the reason is logged for a crash, so currently we don't even know if it really crashed and for what reason. However, with a limited number of Apache requests handled, MariaDB will likely not become subject to excessive RAM usage. You could maybe limit the number of connections or the number of connections per client, just to make sure that a website won't be able to post so many requests against MariaDB that the database needs too much RAM to handle them. For example in /etc/my.cnf:

[mysqld]
max_connections=1000
max_user_connections=100

This would limit the overall number of connections to 1000 and the number of connections per database user to 100.
 
The journal file looks like this:

Aug 21 09:44:39 servername.ipaddress.plesk.page systemd[1]: mariadb.service: A process of this unit has been killed by the OOM killer.
Aug 21 09:44:41 servername.ipaddress.plesk.page systemd[1]: mariadb.service: Main process exited, code=killed, status=9/KILL
Aug 21 09:44:41 servername.ipaddress.plesk.page systemd[1]: mariadb.service: Failed with result 'oom-kill'.
Aug 21 09:44:41 servername.ipaddress.plesk.page systemd[1]: mariadb.service: Consumed 10h 5min 17.784s CPU time, 20.0G memory peak, 7.4G memory swap peak.
Aug 21 09:44:46 servername.ipaddress.plesk.page systemd[1]: mariadb.service: Scheduled restart job, restart counter is at 1.
Aug 21 09:44:46 servername.ipaddress.plesk.page systemd[1]: Starting mariadb.service - MariaDB 10.11.13 database server...
Aug 21 09:44:46 servername.ipaddress.plesk.page (mariadbd)[670726]: mariadb.service: Referenced but unset environment variable evaluates to an empty string: MY>
Aug 21 09:45:03 servername.ipaddress.plesk.page systemd[1]: Started mariadb.service - MariaDB 10.11.13 database server.
 
It means that MariaDB itself doesn't hit the RAM limit, but other processes on your server occupy so much RAM that the RAM manager on the server kills MariaDB. Stop looking for issues with MariaDB, fix the other processes, which are most likely PHP and Apache.
 
Back
Top