• If you are still using CentOS 7.9, it's time to convert to Alma 8 with the free centos2alma tool by Plesk or Plesk Migrator. Please let us know your experiences or concerns in this thread:
    CentOS2Alma discussion

Resolved Messages log is flooding with many grafana alerts

Pleskie

Regular Pleskian
My 'messages' log in directory '/var/log' is flooding with many messages every second. Now over 40.000 lines in the log, all like this:

Apache config:
Jun 11 23:02:08 s1 grafana-server[150672]: t=2021-06-11T23:02:08+0200 lvl=eror msg="Alert Rule Result Error" logger=alerting.evalContext ruleId=3 name="Mail server memory usage" error="request handler error: plugin unavailable" changing state to=keep_state

What's going on?!
 
Same here in the syslog files. Started on June, 9th

Thanks for confirming. On my server it started on June 9th as well.

A few minutes ago I checked Plesk Panel to see if there was an update for Grafana. There was an update and I updated, but it doesn't make any difference at all.

My 'messages' log is still flooding with Grafana errors every single second. The update was done by Plesk Panel so it should be considered a safe update.

Anyone else having their 'messages' log (or maybe 'syslog') flooded with Grafana errors? If so, please reply.

Does anyone know how to solve?
 
@Pleskie There's been quite a few 'teething problems' with Grafana aka Advance Monitoring Extention and Plesk before, but a few of them were actually Grafana bugs, but there was the odd Plesk bug too. They've all been fixed / updated etc to be fair but the usual giveaway was not log entries, but the Advance Monitoring Extention not actually functioning and/or functioning correctly. Have you had chance to look at your Advance Monitoring Extention and it's ability to go back in time / customise time perdiods etc and if so, is it all working as normal?

Edit: Assuming that it isn't here, if that's the case, there will be a a small triangle containing a ! in each of the content boxes. If you click that, you'll get further details of the error, which you can then post on here. - Just dug this out of some previous notes, as thought it woud be helpful (for all) to see more error details
 
Last edited:
Hi @learning_curve where can I check the thing you mentioned? This is a new server and I have not ever used Grafana. The errors in the log started June 9th, same as @Josch is currently experiencing.

Please telle me where to look, so I can provide more information.
 
~ Please telle me where to look, so I can provide more information.
Assuming that you are using the Advance Monitoring Plesk Extension @Pleskie ? That's where all the Grafana stuff is processed / dipslayed within Plesk.
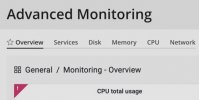
Simply go to that Extension in the Plesk panel (https://your-host-domain:8443/modules/monitoring/index.php/index/main) and the default first screen is the "overview" tab. Right there, assuming no data is being displayed, you'll see the triangle with the ! in the centre of it. Found a handy screengrab on another forum, but it's still clear enough to see the triangle / ! Then follow the previous instructions ^^ re click / copy / paste on here etc :)

AM.jpg
 
Last edited:
Here is my error message from "Advanced Monitoring", when I click at the exclamation mark:

Ubuntu 16.04.7 LTS
Plesk 18.0.34 Update #2
Grafana 8.0.2

Code:
Metric request error

Object
status:500

statusText:"Internal Server Error"

data:Object
message:"Metric request error"

config:Object
url:"api/tsdb/query"

method:"POST"

data:Object
queries:Array[6]
0:Object
queryType:"query"

target:"memory:memory-used:value"

refId:"A"

hide:undefined

type:"timeserie"

datasourceId:1

1:Object
queryType:"query"

target:"memory:memory-cached:value"

refId:"B"

hide:undefined

type:"timeserie"

datasourceId:1

2:Object
queryType:"query"

target:"memory:memory-slab_recl:value"

refId:"C"

hide:undefined

type:"timeserie"

datasourceId:1

3:Object
queryType:"query"

target:"memory:memory-slab_unrecl:value"

refId:"D"

hide:undefined

type:"timeserie"

datasourceId:1

4:Object
queryType:"query"

target:"memory:memory-buffered:value"

refId:"E"

hide:undefined

type:"timeserie"

datasourceId:1

5:Object
queryType:"query"

target:"memory:memory-free:value"

refId:"F"

hide:undefined

type:"timeserie"

datasourceId:1

from:"1623595663984"

to:"1623682063984"

retry:0

headers:Object
X-Grafana-Org-Id:1

hideFromInspector:false

message:"Metric request error"
 
@learning_curve this is what I get when I click the exclamation mark:

Code:
Metric request error
Object
status:500
statusText:"Internal Server Error"
data:Object
message:"Metric request error"
config:Object
url:"api/tsdb/query"
method:"POST"
data:Object
retry:0
headers:Object
hideFromInspector:false
message:"Metric request error"
 
Yeah! That's effectively the same error, on two different OS but both running Plesk Obsidian. It's looking like a Grafana / Plesk Api related glitch (from those posts) but that means, that until some more investigative work is done... at this stage, it's difficult to know if Grafana OR Plesk is at fault. I can't see an identical of similar (close) previous error report, having searched the forums. so if either @IgorG and/or @AYamshanov (both of whom have plenty of experience with these type of issues) don't know the answer to this one, it will be a case of: Important - PLEASE FOLLOW THIS INSTRUCTION IF YOU BELIEVE THAT FOUND A BUG! to get it confirmed as a bug / request a fix.
 
#Bump

Any useful input for this latest Grafana glitch, from our experienced Plesk colleagues? @IgorG / @AYamshanov
 
Any updates on this?

My 'messages' log is still flooding with grafana errors every second. Just updated to grafana 8.0.3-1 using Plesk Panel. Doesn't make any difference. Flooding is still going on.
 
Last edited:
Thanks @learning_curve :)

The page says the problem will soon be updated between 14.06.2021 - 18.06.2021. So that is why I was expecting/hoping the problem would be solved with the last update. Guess I'll have to wait a little longer then. Could also use your downgrade tip. Thanks!
 
The update for grafana 8.0.3 is available except that once the update is complete, the update for grafana 8.0.3 is available. It loops and loops and loops.
 
The update for grafana 8.0.3 is available except that once the update is complete, the update for grafana 8.0.3 is available. It loops and loops and loops.
I deinstalled Advanced Monitoring a few days ago - but there are still new entries in the grafana.log
 
In all of the other associated threads, users have posted that it's been fixed, with the release of Advance Monitoring version 1.4.3 (19th June 2021) c/w the change log details shown below. If your experience is different, maybe re-check where you're up to / what you currently have installed? You could change this thread status to "Resolved" @Pleskie to be honest. Similar to all of the previous glitches with Grafana / Advance Monitoring Extention, it's been fixed quickly.
  • Installing Advanced Monitoring no longer automatically installs the Grafana extension because Grafana has changed its licenses. When you install Advanced Monitoring now, Plesk will prompt you to install the Grafana extension as well and show the button you need to click to automatically install the extension.
  • [-] Updating Grafana to version 8.0 and later no longer breaks the extension. (EXTPLESK-2710)
    Note: To use Advanced Monitoring 1.4.3 with Grafana 8.0, you need to have the Grafana extension version 1.2.3.

 
  • Installing Advanced Monitoring no longer automatically installs the Grafana extension because Grafana has changed its licenses. When you install Advanced Monitoring now, Plesk will prompt you to install the Grafana extension as well and show the button you need to click to automatically install the extension.

What does this mean? On my (clean) server install Advanced Monitoring was installed automatically. I did not install it myself (manually). Does this mean it won't be installed automatically anymore? It says the license of Grafana has changed and you need to click a button to install. What does that imply? If you don't install Grafana, won't Advanced Monitoring work anymore? Or will there be limitations of some sort? And what has changed in the license? Are there restrictions/limitations we should be aware of?

You could change this thread status to "Resolved" @Pleskie to be honest.

Yes, of course. But I'm not online 24 hours a day so I didn't know it was fixed ;)

The initial problem of log flooding has stopped, so that problem seems to be solved. Advance Monitoring in Plesk Panel doesn't show error anymore.
 
What does this mean? On my (clean) server install Advanced Monitoring was installed automatically. I did not install it myself (manually). Does this mean it won't be installed automatically anymore? It says the license of Grafana has changed and you need to click a button to install. What does that imply? If you don't install Grafana, won't Advanced Monitoring work anymore? Or will there be limitations of some sort? And what has changed in the license? Are there restrictions/limitations we should be aware of?
:D You're overthinking it @Pleskie Unless you've decided not to allow them to... Then practically all Plesk Extensions will update themselves automatically.
All you need to do, is check the version numbers of the two Plesk Extensions and assuming that they are as stated above (Advanced Monitoring 1.4.3 / Grafana extension version 1.2.3 ) you're all done. It's that easy (but see below)
The initial problem of log flooding has stopped, so that problem seems to be solved. Advance Monitoring in Plesk Panel doesn't show error anymore.
Thus ^^ almost confirming by default, that the two Plesk Extensions, are exactly as stated above: Advanced Monitoring 1.4.3 / Grafana extension version 1.2.3
 
Last edited:
:D You're overthinking it @Pleskie Unless you've decided not to allow them to... Then practically all Plesk Extentions will update themselves automatically.
All you need to do, is check the version numbers of the two Plesk Extentions and assuming that they are as stated above (Advanced Monitoring 1.4.3 / Grafana extension version 1.2.3 ) you're all done. It's that easy (but see below)

Thus ^^ almost confirming by default, that the two Plesk Extentions, are exactly as stated above: Advanced Monitoring 1.4.3 / Grafana extension version 1.2.3
No - they did not!
After a reinstallation Advanced Monitoring (today) the grafana.log contains this:
---------------------------------
t=2021-06-21T11:44:08+0200 lvl=warn msg="plugin failed to exit gracefully" logger=plugins.backend pluginId=grafana-simple-json-backend-datasource
t=2021-06-21T11:44:11+0200 lvl=warn msg="Running an unsigned plugin" logger=plugins pluginID=grafana-simple-json-backend-datasource pluginDir=/var/lib/grafana/plugins/grafana-simple-json-backend-datasource/dist
t=2021-06-21T11:44:11+0200 lvl=eror msg="Failed to start plugin" logger=plugins.backend pluginId=grafana-simple-json-backend-datasource error="Incompatible API version with plugin. Plugin version: 1, Client versions: [2]"
t=2021-06-21T11:44:11+0200 lvl=warn msg="Running an unsigned plugin" logger=plugins pluginID=plesk-json-backend-datasource pluginDir=/var/lib/grafana/plugins/plesk-json-backend-datasource/dist
t=2021-06-21T11:44:11+0200 lvl=eror msg="Failed to read plugin provisioning files from directory" logger=provisioning.plugins path=/etc/grafana/provisioning/plugins error="open /etc/grafana/provisioning/plugins: no such file or directory"
t=2021-06-21T13:06:08+0200 lvl=eror msg="Alert Rule Result Error" logger=alerting.evalContext ruleId=19 name="Plesk memory usage" error="request handler response error {invalid status code. status: 500 Internal Server Error A <nil> [] [] 0xc000b5db60}" changing state to=keep_state
t=2021-06-21T13:06:08+0200 lvl=eror msg="Alert Rule Result Error" logger=alerting.evalContext ruleId=17 name="Mail server memory usage" error="request handler response error {invalid status code. status: 500 Internal Server Error A <nil> [] [] 0xc00100d7d0}" changing state to=keep_state
---------------------------------
'Advanced Monitoring' is a part of the common 'Plesk Extensions' and not a part of the 'Extensions Catalog'
 
Last edited:
Back
Top