• Plesk Uservoice will be deprecated by October. Moving forward, all product feature requests and improvement suggestions will be managed through our new platform Plesk Productboard.
    To continue sharing your ideas and feedback, please visit features.plesk.com

Question Mysql memory usage and memory used by system reach 90% of available ram and then crash

thinkjarvis

Basic Pleskian
Server operating system version
Ubuntu 24.04.3 LTS
Plesk version and microupdate number
18.0.71 #2 build1800250729.09
Hi We are seeing this process on all of our plesk servers.

Each server hosts a mix of wordpress and wordpress woocommerce sites with an excellent degree of optimisation on them. 99% of the sites pass web vitals or are extremely close to passing due to design decisions or plugins used.

1756462749756.png

Screenshot above is for reference only just so you can see where we are seeing the issue.

Over a period of 24 - 72 hours
The ram usage and swap hit 100%
The ram is shown as rising to 90% system and approx 10% domains
We then get a spike in phpfpm - The client gets increased checkouts on their ecommerce store
Plesk cannot re-allocate the memory
CPU still looks fine
MariaDB crashes

Upone restarting mariadb - The memory starts from scratch building again until this process repeats.

We have had to schedule a nightly cron to restart mariaDB to prevent this cycle crashing the server.

Can anyone give me suggestions as to how I can cap the ram "used by system" so that it manages itself and flushes things it shouldnt be keeping in ram?
Can anyone give me suggestions as to how I can stop mysql memory usage climbing uncontrolably?

Note the Innodb sizes are all set optimium. Changing these settings has made no difference to what we are seeing.

I will point out that the actual ram used value is well within tollerances and nowhere near capacity.

The server has 18cpu cores and 40gb of ram in an enterprise server setup.
The hosting provider is a managed host and has had multiple linux engineers looking at the problem but we are struggling to find a solution.

Last 7 days: each crash in memory is us restarting mariadb due to the websites becoming slow and then unresponsive
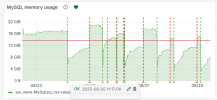
1756463194646.png

Each peak shown below is a crash which correlates perfectly with the mysql becoming too full.
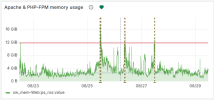
1756463251585.png

The CPU also correlates with the mysql and phpfpm usage
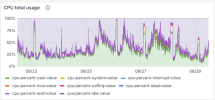
1756463327748.png


Swap has been adjusted over time but you can see that our last crash a couple of days ago spiked the swap usage to maximum
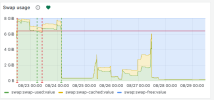
1756463507078.png

The traffic figures do not directly correlate but the phpfpm spikes correlate with increased checkout activity in line with a marketing schedule.


Mysql is exceeding limits set in innodb_
Its not emptying itself
memory used by system hits 90% of that available
mariadb also eventually flags 90% of that available
everything crashes at peak load

The crashes only occur when mysql hits its critical point and swap fills itself

Is there a setting I am missing specifically that should purge mysql?

A timeout value?

Note we have ran mysqltuner and further tweaked those settings.

Tried high and low values and still not seeing the memory use stabalising just a gradual upward line.
 
@WebHostingAce I've been discussing this with @Bitpalast on the post here:


We have not got a conclusion yet but as @Bitpalast has suggested it appears to be a problem with PHP processes rather than mysql itself. Our Mysql config is extremely well optimised.

HOWEVER the result of the PHP processes is that memory is not getting cleared when a process finishes. So the mariadb memory climbs until it fills the entire cache and then in a situation of high phpfpm requests - instead of flushing mariaDB it just kills the process - taking all sites down on the server.

Temp solution - Working very well
We have set up a cron job to restart mariaDB at 3am every day. This flushes the db caches so we have a clean slate every 24hours.

Mitigation solutions
A deep dive into the website and database has revealed several issues. We have:
  1. Reduced the size of the database from 11GB to 5.75GB
  2. Ran Optimise Tables on all tables
  3. Re-wrote a couple of intensive queries
  4. Disabled some background logging processes to reduce php processes
  5. Enabled more page caching features to reduce php and db requests
  6. Added more bot mitigation rules - including blocking google and bing from query strings using mod_security
  7. Added REDIS to all other sites on the server
  8. The result is a drop of approx 3-12GB depending on where you measure it from over a 24 hour period
  9. We will attempt to disable the mariadb restart soon and see if things overload again or stabalise.

I am exploring a few options for perminent solutiuons:
Changing to Jemalloc or tcmalloc - Currently trialing this on 2 of our servers

Changed the mysqli setting for persistent connections to OFF. Increased the number of pm.max_requests to 100 from 50 - To see if it is the number of demanding processes spawning causing the problem (Lower number means more respawns).

What I am struggling with right now is that the memory allocation happens during a backup but when the backup is finished it doesnt flush that memory allocation so after a period of a few days the mysql memory consumption consumes the server.
 
What I am struggling with right now is that the memory allocation happens during a backup but when the backup is finished it doesnt flush that memory allocation so after a period of a few days the mysql memory consumption consumes the server.
It sounds like you’re describing a situation where, during the backup process, memory usage (specifically the buff/cache value) increases, and after the backup completes that memory isn’t released back to the “free” pool. If that’s the case, this is actually the expected behavior of Linux.

Have you tried “Dedicated FPM application served by nginx” per website?

Eg -

PM: dynamic
pm.max_children: 100 (adjust to available RAM and avg worker size)
pm.max_requests: 500 (recycles workers to avoid leaks)
Set start/min/max spare servers accordingly for your traffic

This setup isolates each site, reduces handler overhead, and usually gives more stable performance under load.

Its not just the backup its everything

So over 24-72 hours the ram hits 100% usage with mariadb taking up 90% of that and system the other 10%. If we then get a spike in traffic or an increase in phpfpm requests then the memory still doesnt flush to accomodate those requests. Instead of flushing things to make space, the server kills mariadb.

When I say 100% its showing that in the plesk process list but the actual physical usage is only about 27gb out of the 40gb total.

The backup is just a consistent example of something that causes mysql memory usage to balloon. But over 3 days it will add 12-20gb to the memory usage by mysql.

I think trying a dedicated FPM might be a good idea to see if this helps resolve the problems.

I'll trial this and let you know how this affects things.
 
my.cnf
[mysqld]
max_connections=300
sql_mode=ERROR_FOR_DIVISION_BY_ZERO,NO_AUTO_CREATE_USER,NO_ENGINE_SUBSTITUTION
bind-address = 127.0.0.1
local-infile=0

slow_query_log = 1
slow_query_log_file = /var/log/mysql/slow.log
long_query_time = 10
log_queries_not_using_indexes = 0

Separate included cnf file
[mysqld]
# InnoDB memory
innodb_buffer_pool_instances = 8
thread_handling = pool-of-threads

# Connection & Transaction Timeouts
wait_timeout = 150
interactive_timeout = 150
connect_timeout = 10
net_read_timeout = 30
net_write_timeout = 30

# Idle Transaction Cleanup
idle_transaction_timeout = 300
idle_readonly_transaction_timeout = 300
idle_write_transaction_timeout = 300

# InnoDB Lock Handling
innodb_lock_wait_timeout = 30
lock_wait_timeout = 300
innodb_rollback_on_timeout = ON

# Per-connection memory
sort_buffer_size = 1M
join_buffer_size = 1M
read_buffer_size = 128K
read_rnd_buffer_size = 256K
tmp_table_size = 8M

innodb_max_dirty_pages_pct = 30

Plesk optimiser separate cnf file
# next values added by Plesk Performance Booster
[mysqld]
innodb_flush_log_at_trx_commit = 2
innodb_flush_method = O_DIRECT_NO_FSYNC
innodb_io_capacity = 450
innodb_random_read_ahead = ON
innodb_buffer_pool_size = 10737418240
innodb_log_file_size = 2684354560
# values above added by Plesk Performance Booster
 
Do you mean that the MySQL memory usage itself is actually growing over 30 GB or so?

~15 GB under load is normal.
If you look at the Process list from within plesk or h Top

MariaDB eventually occupies the entire 40GB of ram (it stops growing when it consumes about 90%).

The process list and h top both show the ram usage including cache values at 100% used.

So the actual physical usage at 15-20gb is normal but left without a restart The cached value for mariaDB fills the remaining space up to 90% of the entire server leaving only 10% for system and domains.

This can only be seen in the process list or h top.

At this point there isnt enough memory cached or physical available for phpfpm - This causes the system to kill mariaDB INSTEAD of clearing off some memory.

Ironically of course the PHP fpm processes are causing the mysql memory to fill so it defeats itself within 24-72 hours.

mysql/mariaDB is not releasing/flushing memory to make space for the php processes to run and I have no idea why!
 
Ok. If I understand correctly, you are talking about buffer/cache. Not the physical memory usage by MariaDB.

Page cache is global and reclaimable; MySQL can’t “flush” or “release” it— the kernel does that on demand.

Fast spike + slow reclaim => OOM kills the biggest target (often mysqld).

Try to lower the MariaDB config.

max_connections = 150
sort_buffer_size = 512K
join_buffer_size = 512K
tmp_table_size = 8M
max_heap_table_size = 8M
innodb_buffer_pool_size = 6G

Leave some memory for other process/reclaim
 
We did increase the sort and join buffers as part of trying to resolve the issue.

But Max connections could easily be halved.
We've only ever ran out of connections on one server and that was because max connections was 150 and there were over 150 websites on the server with 150 dbs.

The current open threads is only 7 so 300 is overkill for the number of sites on the server. (approx 10 with the one large one.)
 
Ultimately we may end up doing that.

Its very frustrating because the real problem is not to do with hitting a hard limit - The memory just isnt being used efficiently enough by the system

Thank you for your input. I'll see about reducing the max_heap_table_size as that would make a lot of sense to prevent the memory getting eaten by tmp tables.

I'll be disabling the mariadb restart after a few more tests and see if mysql continues to grow uncontrolably. We have shrunk the databases massively so this might be enough to reduce the size of whatever is filling the cache.

My remaining actions are:

  1. Swap to Jemolloc or TCMalloc - Currently testing both on our other servers
  2. Reduce max connections
  3. Try changing to dedicated fpm over apache (To replicate the current setup)
  4. Ask the client to further optimise their site - to reduce the size of queries.
    1. Note we have several websites using the same base wordpress theme setup that dont have this issue - But the traffic volumes are so small it would be comparing apples and oranges.
  5. Cloudflare - We dont use cloudflare at the moment but will look to offload some of the http requests to CDN for static assets to help smooth things out. (Kind of a sideline to the actual issue but everything helps!)
 
I don’t think the issue you’re seeing is directly caused by MariaDB.

Given the FPM memory usage and the CPU spikes, it looks more like the server is simply running tight on resources at times.

As I mentioned earlier:

Fast spike + slow reclaim ⇒ the OOM killer targets the largest process (often mysqld).

You can look into such as;

In mysqld.service (systemd), set OOMScoreAdjust=-500

vm.dirty_background_ratio
vm.dirty_ratio

Etc..
 
No, it does not, and you know it does not, because we already went through this in the other thread.

It doesnt occupy the phyiscal memory which you can see in the figures in the monitoring panel - Which we discussed

But it does then occupy 90% of the available memory as cache value and refuses to release it.

This can be seen in h top and plesk > process list.

From the two threads I can see three possible solutions
  1. Make Mysql manage itself properly - Which as you suggested you dont think we have a problem with because the settings are optimal
    1. Still think something is amiss here
  2. Work out what process is uncontrollably getting cached by mysql/mariadb to a point where there isnt enough memory for phpfpm
    1. Likely a PHP process/memory leak?
  3. Add more ram
Any further objections? @Bitpalast
 
It doesn't release the cache, because it does not need to release it. From MariaDBs perspective, it has plenty of RAM left. The problem is that the system starts occupying RAM outside MariaDB, and that triggers OOM to kill MariaDB, because that memory manager thinks it needs to clear RAM. But the cause for all of this is not MariaDB but something else, which brings us back to Apache and PHP.
 
Back
Top