• Plesk Uservoice will be deprecated by October. Moving forward, all product feature requests and improvement suggestions will be managed through our new platform Plesk Productboard.
    To continue sharing your ideas and feedback, please visit features.plesk.com

Question Mysql memory usage and memory used by system reach 90% of available ram and then crash

It doesn't release the cache, because it does not need to release it. From MariaDBs perspective, it has plenty of RAM left. The problem is that the system starts occupying RAM outside MariaDB, and that triggers OOM to kill MariaDB, because that memory manager thinks it needs to clear RAM. But the cause for all of this is not MariaDB but something else, which brings us back to Apache and PHP.
Ok Any ideas how I can investigate further?

Am I looking for a bad PHP process on the website or am I looking for a PHP setting to change the behaviour?
 
On the other thread I already suggested to look at Apache's RAM usage and to limit it so that it can never exceed a certain value. If Apache is consuming a lot of RAM, it either has spawned too many children or PHP processes executed by it occupy the RAM. So first check Apache, then go after PHP processes. I bet there are either tons of them occupying RAM or some runaway processes in infinite loops that keep requesting more and more.

Here's another magic command line that will let you monitor the most important aspects "live":
# MYSQL_PWD=`cat /etc/psa/.psa.shadow` watch "uptime && echo "\ " && ps aux | sort -nrk 3,3 | head -n 20 && echo "\ " && mysqladmin proc status -u admin"
(Stop with Ctrl+C)

Also simply counting processes might reveal more, or just looking at PHP RAM usage (all through the # ps directive on the command line).
I can see a few processes with the same PID hanging around but I have no idea how to identify what is actually continuing to run.

The number of users is changing from approx 12 to 21 but has fallen to between 12 and 15 while I have been watching approx..

And threads reasonably stable from 2-10 depending on activity.

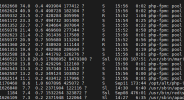
Approx 16 our of the 20 displayed records are phpfpm from the one website. Which is right given how much traffic they get.

I cannot see anything particularly unusual looking. The only queries I can really see are action scheduler, and shop filters and then the shop search and filter functions pinging some slightly longer queries.

Is there anything I can send on here that will help you see what I am seeing.

1757689027878.png
 
Following on from this the PID number does appear to be cycling. So the queries are completing sensibly.

Looking at the physical and virtual memory use - There is quite high memory use per PHPFPM activity so if we can bring this down then it would improve the situation.
 
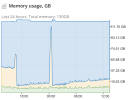
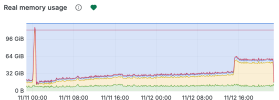
I'm currently having a similar issue where cached memory spikes around midnight, but everything else stays stable. I'm not exactly sure how much it would’ve built up since I caught it mid-build and stopped it, but no matter what I do, I can’t seem to trigger it again. I’ve tried everything, I’m honestly at a loss for words and out of forum posts to dig through. I’ve even turned off NGINX caching on almost all my sites, but it’s still caching to RAM.1762885899892.png
 
This may be true - But the server has 128gb of ram the daily script shouldnt have done that.

Does this coincide with a backup via the backup manager?
We have found that the backup manager when backing up databases consumes mysql/mariadb memory and doesnt release it. This can cause problems where the DB memory takes up too much space relative to php-fpm memory. The two then fight eachother which can cause the server to kill mysql/mariadb.

Solution: How did we fix our issues?
We took a multi-pronged approach. The goal being to reduce memory consumption

  1. We swapped to TCMALLOC for the db cache management which reduced usage significantly
  2. Reduced the INNODB buffer to a level more relevant to the max table sizes on the biggest website on the server.
  3. Manually optimised the database on the biggest site - Essentially we halved the size of the database due to redundant records in the clients wordpress installation.
  4. WP_Options had become a bloated mess over time. We also stripped and deleted other unused tables.
  5. This process was a double edged sword - Reducing the size of the DB, also reduced the time php-fpm requests take to complete - Bringing down the overally memory usage. By shrinking the Database - We also reduced the size of the open table cache and generla db caches managed by plesk.
  6. Changed the way http requests work on the site - Enabled script merging for some parts of the site which reduces http requests and also has a knock on effect on php-fpm
  7. Added REDIS to all sites on the server
  8. Enabled enhanced DOS in Imunify 360
  9. Enabled rate limiting in WordFence locally on all sites with a blocking policy
  10. We also use a DB optimisation stack which we purchased for about £5k on studio license - This reduces the time db and php-fpm actions take.

The result was a drop in mysql memory usage in a 24 hour period of 16gb of ram.

The nightly backup spikes for us have become smaller because the DB is half the size it was. Therefore less alocated ram to backup the DBs.

I hope this helps.

HOWEVER a spike like that could have been a random bot attack. Or an inefficient script being hit by too many real visitors at once.
 
Back
Top