• If you are still using CentOS 7.9, it's time to convert to Alma 8 with the free centos2alma tool by Plesk or Plesk Migrator. Please let us know your experiences or concerns in this thread:
    CentOS2Alma discussion

Resolved 500 internal server error [How to find more information about it]

LionKing

Regular Pleskian
Server operating system version
Ubuntu Linux
Plesk version and microupdate number
18.048
So we have this app running web cron and now we are getting the dreaded 500 internal server error. But that is not the issue itself:
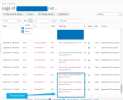
1685959919849.png
The issue is that Plesk do not give you more information about the 500 error itself. So it is very complicated to attempting to solve this issue when we have no leads/clues on how/why the 500 error is generated.

Any ideas on how to get more detailed log information that one could use to lead you in the right direction and find the real cause of the issue?

Thanks in advance.
 
Do you have access to the /logs directory? Can you check what is logged to error_log and access_ssl_log? Do you have any filters set in the GUI so that the display is limited to only one of these?
 
Thanks for the reply Peter.
Do you have access to the /logs directory?

Well yes though Linux with elevated privileges I suppose we can access that.
So there is no way to configure Plesk to display this information directly in the GUI itself?
Do you have any filters set in the GUI so that the display is limited to only one of these?
No, not really. Only the default three click options on the domain level.. (like the screenshot above in the initial post).
 
In error_log there should practically always be a phrase in the log message that mentions the reason for the web server error.
 
There are several logs where you can take a look at:
In the problem site, you have a "logs" folder which may be accessed through SSH or Plesk directly and of course, you also have the server-wide logs at /var/log
 
@LionKing you could check, if you haven't already, if error logging is enabled at all for the domain (and perhaps even at script level), if you are absolutely positive there are no further related error messages in the log files (and cron job calls a PHP script). If error logging is disabled then there would be no further error messages in the log files.
 
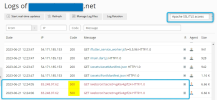
1687344430219.png
It only tell that you have the 500 internal server error. But we like to know the reason behind why the 500 error is created.
So basically its a "nothing burger" as we have no information that leads us to the real issue so we can solve it on our server.
 
How do we do that?
Thanks..
I assume it's a PHP script. In Plesk go Tools & Settings > PHP Settings and click on any of handlers of the PHP version you're using to run the cronjob. Then click the php.ini tab and search for log_errors. The value should be on. If the value for log_errors is already set to on then you'll have to search true the script code to see if error logging is disabled. Search for log_errors and error_reporting trough the code.

If that doesn't yield any result either you can (temporary) enable error display (in Plesk go to example.com > PHP settings and set display_errors to on) and manually access the cronjob page via your browser. It should display the error(s) in your browser.

Don't forget to disable error display again after your done. Leaving it on is a security risk.
 
I guess we we'll do that and also enable debug in the Laravel code.
The server is self in regards to the above in this thread doesn't seem to reveal much why apache pukes the 500 error.
 
You need to look into the log files in /logs, e.g. /logs/error_log.
So I finally have some time to go through this error on our company server. The mentioned log file doesn't exist in "/var/log". the error_log file simply doesn't exist. So that is a dead end for me to figure out what is wrong here.
 
I assume it's a PHP script. In Plesk go Tools & Settings > PHP Settings and click on any of handlers of the PHP version you're using to run the cronjob. Then click the php.ini tab and search for log_errors. The value should be on. If the value for log_errors is already set to on then you'll have to search true the script code to see if error logging is disabled. Search for log_errors and error_reporting trough the code.

If that doesn't yield any result either you can (temporary) enable error display (in Plesk go to example.com > PHP settings and set display_errors to on) and manually access the cronjob page via your browser. It should display the error(s) in your browser.

Don't forget to disable error display again after your done. Leaving it on is a security risk.
Thanks for the suggestions!

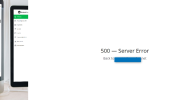
Unfortunately all your suggestions doesn't yield any results. I'm still stuck with the default splash error screen (and I have enabled debug mode too in the larvavel app too (including PHP of course):
1689096204715.png
Still searching with a torch in the server for any clues. Haven't found any so far.
 
After googling a bit it seems you're not the only one who doesn't have any error logs when Laravel encounters a 500 error. Maybe these links are of any help to you:

How to debug Laravel error 500 with no logs, no information
Thanks a bunch @Kaspar ;)

I tapped out out and ran a forced update of our system app and it seems to fixed the issue. Not sure why or what generated the 500 error which would have been useful to know for future internal reference.

I'm suspecting some of the web apps files must have been corrupted and when the update ran these files where overwritten during the updated and thus refreshed.

Anyway - thanks everyone for chipping in and attempting to assist me with this issue. I am thankful to your all.

Kind regards
 
Back
Top