• Our team is looking to connect with folks who use email services provided by Plesk, or a premium service. If you'd like to be part of the discovery process and share your experiences, we invite you to complete this short screening survey. If your responses match the persona we are looking for, you'll receive a link to schedule a call at your convenience. We look forward to hearing from you!
  • We are looking for U.S.-based freelancer or agency working with SEO or WordPress for a quick 30-min interviews to gather feedback on XOVI, a successful German SEO tool we’re looking to launch in the U.S.
    If you qualify and participate, you’ll receive a $30 Amazon gift card as a thank-you. Please apply here. Thanks for helping shape a better SEO product for agencies!
  • The BIND DNS server has already been deprecated and removed from Plesk for Windows.
    If a Plesk for Windows server is still using BIND, the upgrade to Plesk Obsidian 18.0.70 will be unavailable until the administrator switches the DNS server to Microsoft DNS. We strongly recommend transitioning to Microsoft DNS within the next 6 weeks, before the Plesk 18.0.70 release.
  • The Horde component is removed from Plesk Installer. We recommend switching to another webmail software supported in Plesk.

Question after update Mariadb 10.11.10 Monotoring with Grafana dosent work

shopuser

Basic Pleskian
Server operating system version
Ubuntu 22.04.5 LTS
Plesk version and microupdate number
Plesk Obsidian 18.0.65 Update 2 Web Host Edition
After the update in mariadb monitoring with grafana no longer works :
the message comes


An unexpected error occurred
 
There are no current entries in this regard only the one from 26.10.24 before the MariaDB update

#28 /opt/psa/admin/plib/modules/monitoring/vendor/mezzio/mezzio/src/Middleware/LazyLoadingMiddleware.php(23): PleskMonitoring\Laminas\Stratigility\Middleware\ErrorHandler->process(Object(PleskMonitoring\Laminas\Diactoros\ServerRequest), Object(PleskMonitoring\Laminas\Stratigility\Next))
#29 /opt/psa/admin/plib/modules/monitoring/vendor/laminas/laminas-stratigility/src/Next.php(43): PleskMonitoring\Mezzio\Middleware\LazyLoadingMiddleware->process(Object(PleskMonitoring\Laminas\Diactoros\ServerRequest), Object(PleskMonitoring\Laminas\Stratigility\Next))
#30 /opt/psa/admin/plib/modules/monitoring/vendor/laminas/laminas-stratigility/src/MiddlewarePipe.php(69): PleskMonitoring\Laminas\Stratigility\Next->handle(Object(PleskMonitoring\Laminas\Diactoros\ServerRequest))
#31 /opt/psa/admin/plib/modules/monitoring/vendor/laminas/laminas-stratigility/src/MiddlewarePipe.php(59): PleskMonitoring\Laminas\Stratigility\MiddlewarePipe->process(Object(PleskMonitoring\Laminas\Diactoros\ServerRequest), Object(PleskMonitoring\Laminas\Stratigility\EmptyPipelineHandler))
#32 /opt/psa/admin/plib/modules/monitoring/vendor/laminas/laminas-httphandlerrunner/src/RequestHandlerRunner.php(68): PleskMonitoring\Laminas\Stratigility\MiddlewarePipe->handle(Object(PleskMonitoring\Laminas\Diactoros\ServerRequest))
#33 /opt/psa/admin/plib/modules/monitoring/vendor/mezzio/mezzio/src/Application.php(43): PleskMonitoring\Laminas\HttpHandlerRunner\RequestHandlerRunner->run()
#34 /opt/psa/admin/htdocs/modules/monitoring/index.php(17): PleskMonitoring\Mezzio\Application->run()
#35 /opt/psa/admin/htdocs/modules/monitoring/index.php(18): {closure}()
#36 {main}


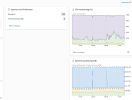
at the start/home i can see CPU and memory

1732887514499.png
 
Seems you provided only partial stack trace, that does not provide us enough information to see what is failing
 
strangely enough, it's been working again since this morning, maybe because some automatic updates were performed during the night
 
Back
Top