• The APS Catalog has been deprecated and removed from all Plesk Obsidian versions.
    Applications already installed from the APS Catalog will continue working. However, Plesk will no longer provide support for APS applications.
  • Please be aware: with the Plesk Obsidian 18.0.78 release, the support for the ngx_pagespeed.so module will be deprecated and removed from the sw-nginx package.

Question Any way for a server monitoring tool to end customer

gennolo

Basic Pleskian
Hi ,

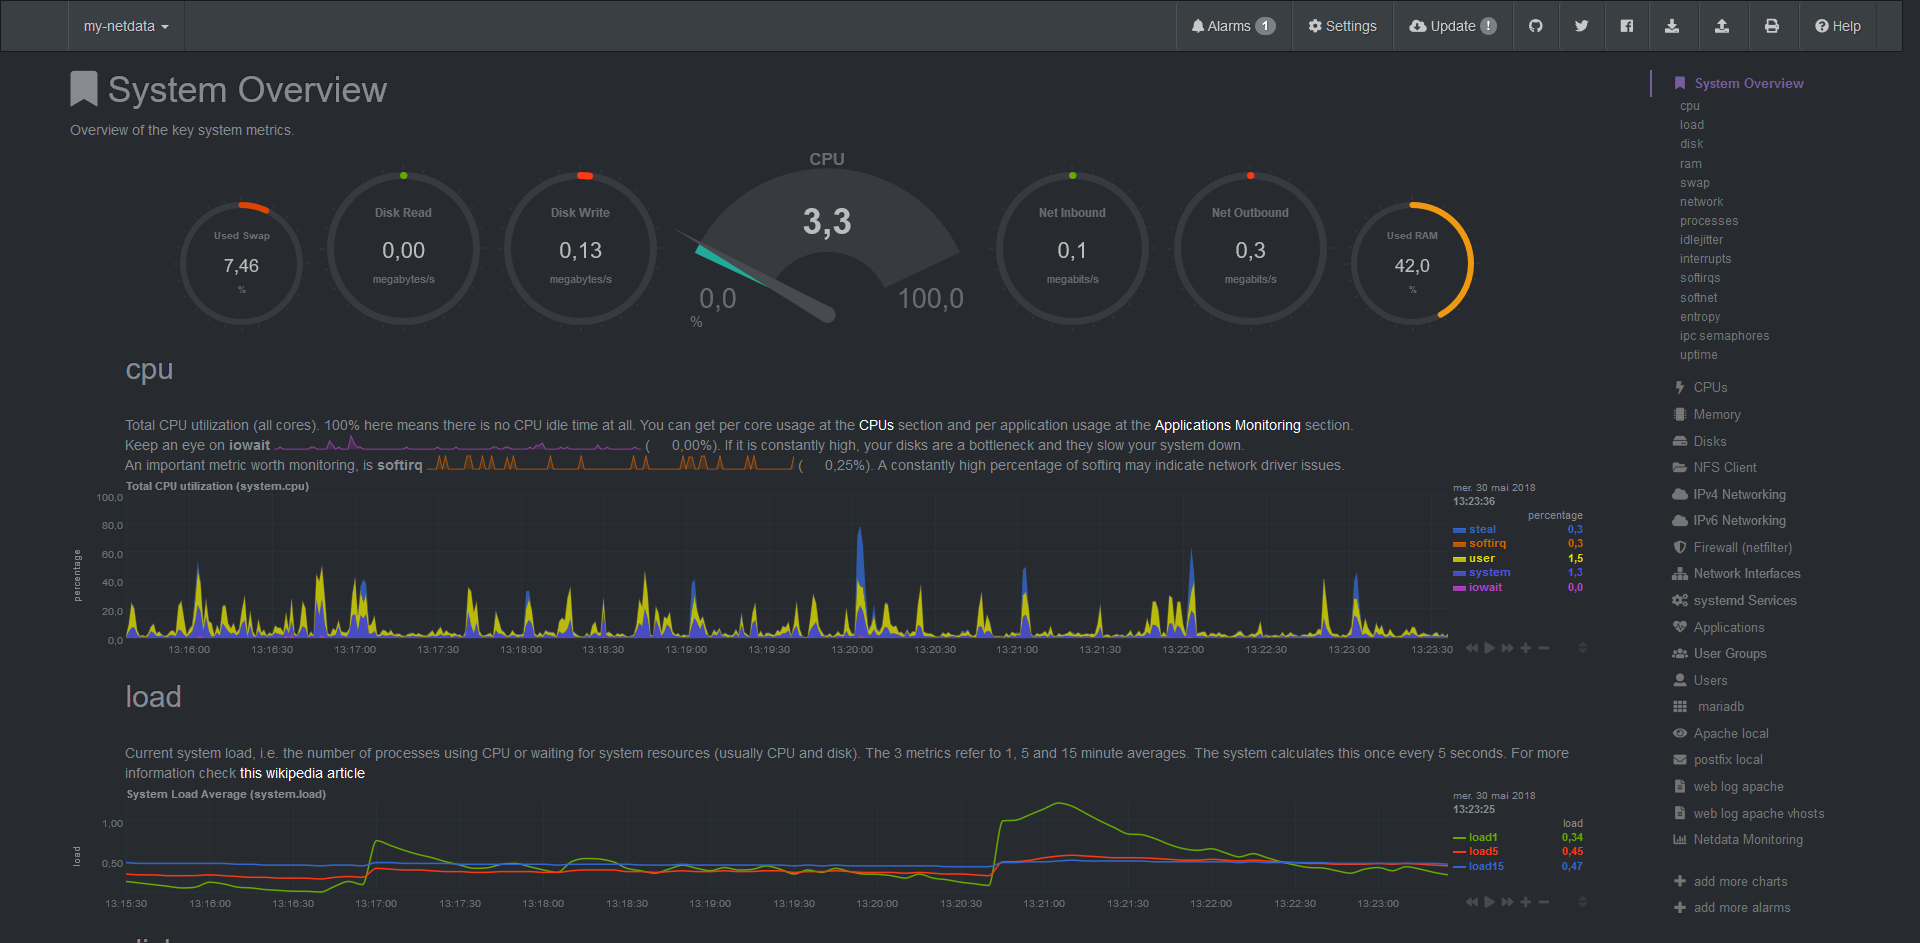
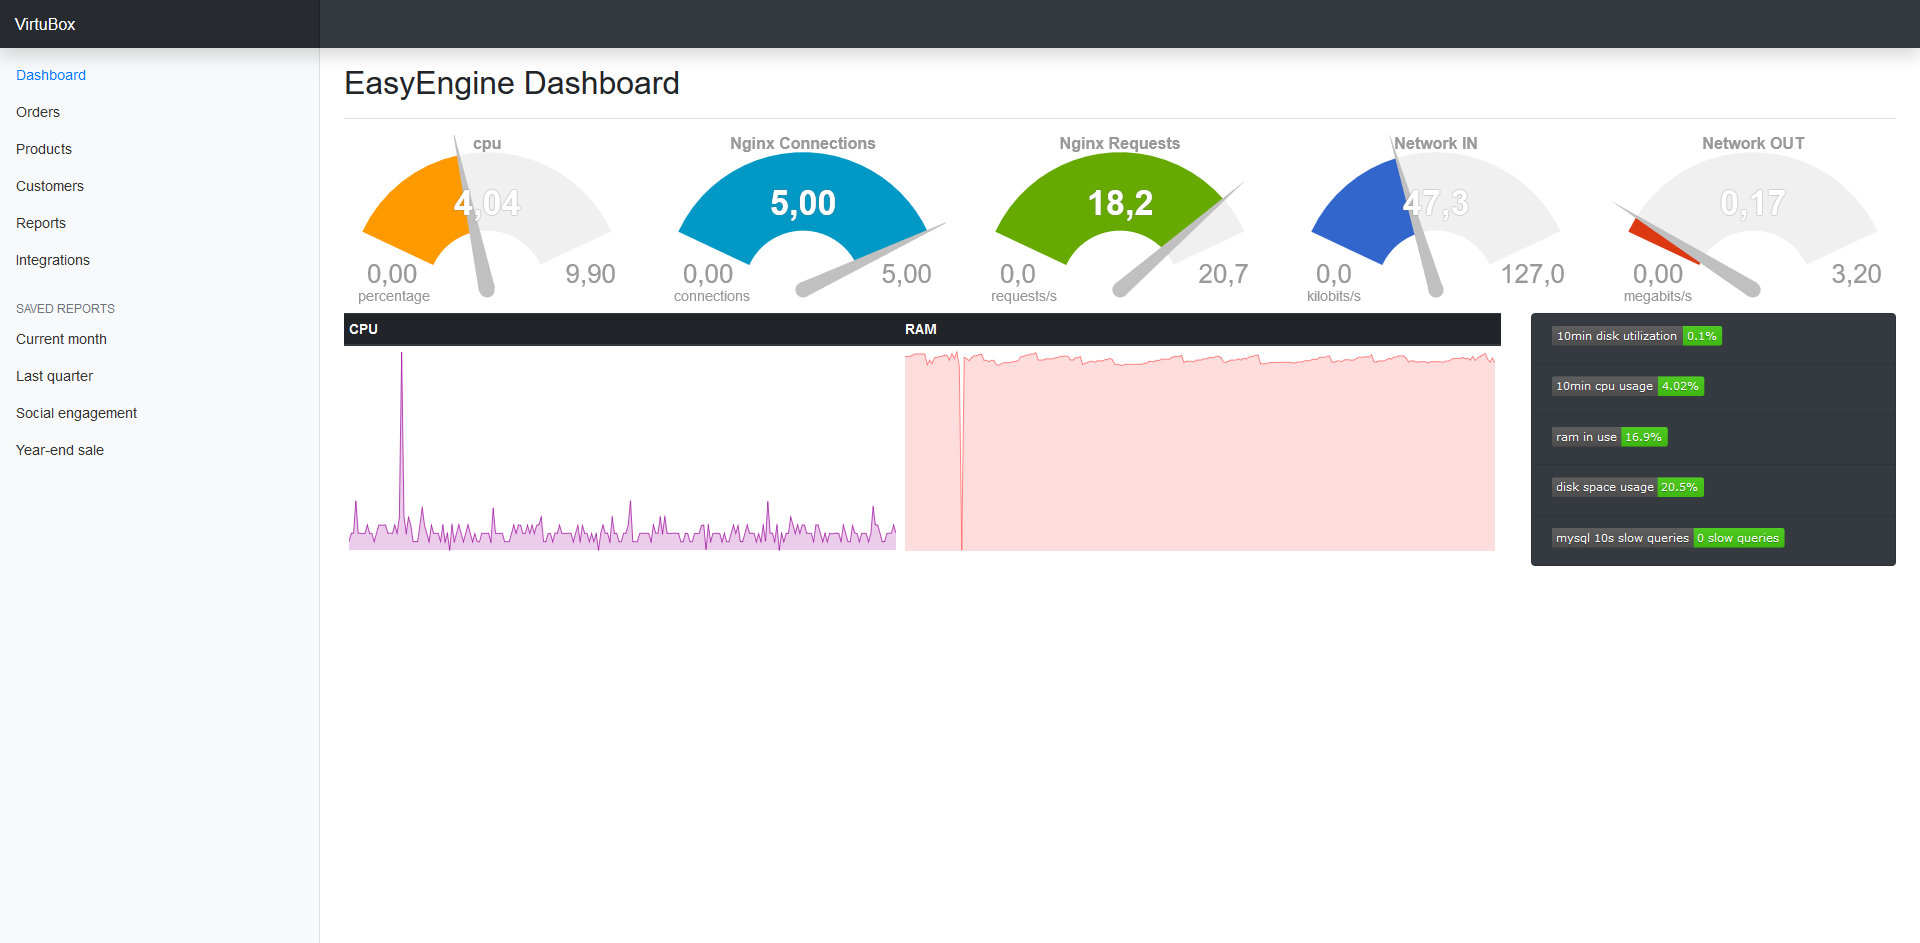
I wonder what would be the best way to offer an end customer / subscriber
a way to have a whole server monitoring tool (CPU usage / RAM / Disk etc.)
in Plesk without giving him Plesk admin credentials, in a single-customer Plesk box scenario.

As far as I understand all the monitoring plugins (Server Health Monitor, Watchdog..)
are only reachable from an administrative account (or am I missing something ?)

Thank you.
 
Why do you think that knowledge about the consumption of resources by a server can be of interest to end users? In my opinion, monitoring and managing the entire server's resources is a privilege only for the administrator of this server.
 
Had several scenarios in "semi-managed" VPS renting where it was requested by the end user to be capable of monitoring 24/7 of the used resources by his server
(for example by monitoring specific scripts or during website bottlenecks troubleshooting) or even to convince him that some slowdowns were not resource related.

You can install netdata to provide a live monitoring dashboard to end users. It can be installed in few minutes, there are a lot of plugins available to monitor all service and it's resources footprint is low. You can use nginx as reverse-proxy to give access to the dashboard on https://yourenduserdomain.tld/netdata/

Screenshot_2018-05-30GetcontrolofyourLinuxServersSimpleEffectiveAwesome.png


Netdata automated installation :
Code:
bash <(curl -Ss https://my-netdata.io/kickstart.sh) all
 
@virtubox : This is definitely what I was looking for , so thank you for your suggestion !
Have you already experienced installing it alongside Plesk ?
I see that this tool is opening TCP port 19999 and install some OS packages / dependencies...
My fear is that it could "conflict" in some way with panel itself.

I'm running netdata on all my Plesk servers without any issues. Netdata use the port 19999 by default, but you can use another port and if your firewall is enabled, netdata dashboard will only be available on localhost. That's why in most of case, it's better to use nginx as reverse-proxy, to access netdata under https, and to set add an authentication with a htpasswd.

Otherwise, you can still create your own dashboard with netdata metrics :

Screenshot_2018-05-31CustomNetdataDashboardbyVirtuBox.png
 
Back
Top