• If you are still using CentOS 7.9, it's time to convert to Alma 8 with the free centos2alma tool by Plesk or Plesk Migrator. Please let us know your experiences or concerns in this thread:
    CentOS2Alma discussion

Issue apache mpm_event alert AH03104 unable to create worker thread

PeterKi

Regular Pleskian
Server operating system version
Ubuntu Linux 22.04.1 LTS
Plesk version and microupdate number
plesk obsidian 18.0.51 WebAdmin Edition
On my Ubuntu 22 LTS server, I frequently see errors like the following in the apache2/error.log
[mpm_event:alert] [pid 653600:tid 140299242296896] (11)Resource temporarily unavailable: AH03104: apr_thread_create: unable to create worker thread
My server is used mainly for email and I do not host any websites.
My server traffic average is less than 200 MB/day, but I get the alert about 150 times/day.
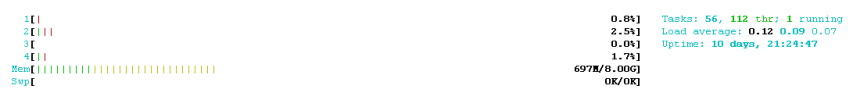
The server has 4 CPUs, the typical load is below 0.1 and I do not see any bottlenecks.
How can I get rid of this event or find the cause of it?

# plesk bin optimization_settings -s | grep " on" access_compat on auth_basic on authn_core on authz_core on autoindex on cgi on deflate on dir on fcgid on filter on headers on include on negotiation on passenger on proxy on proxy_fcgi on proxy_http on proxy_wstunnel on reqtimeout on rewrite on setenvif on socache_shmcb on status on suexec on
userdir on
 

Attachments

  • 2023-03-31 09_23_29 _var_log_apache2.png
    2023-03-31 09_23_29 _var_log_apache2.png
    3.9 KB · Views: 2
Add On:
On my old Ubuntu 20 Server with Plesk Obsidian 18.0.51 I did only find the AH03104 error 11 times in the past year.
The old server did only have 4GB of RAM instead of the 8GB on my new server.
Also, the old server had 2 CPUs instead of 4 CPUs now.
Resources are much better now than before.
The old server ran apache 2.4.41 whereas the new runs apache 2.4.52.
The only differences I found on the apache modules is that the new server has the passenger module enabled.
 
This behavior can be caused by too high values set in /etc/apache2/mods-available/mpm_event.conf. Example for a problematic configuration (yours can be different, but see a recommend configuration further down):
Code:
# cat /etc/apache2/mods-available/mpm_event.conf
 (...) 
 <IfModule mpm_event_module> 
 StartServers 200 
 MinSpareThreads 1000 
 MaxSpareThreads 5000 
 ThreadLimit 2000 
 ThreadsPerChild 2000 
 ServerLimit 50000 
 MaxRequestWorkers 50000 
 MaxConnectionsPerChild 0 
 </IfModule> 
 (...)
Recommended:
Code:
<IfModule mpm_event_module>
StartServers 1
MinSpareThreads 1
MaxSpareThreads 4
ThreadLimit 64
ThreadsPerChild 25
MaxRequestWorkers 150
MaxConnectionsPerChild 0
</IfModule>
After changing the configuration file, please restart Apache (as root service apache2 restart).
 
I haven't changed anything in the apache conf from the default values.
And the settings on the old server are the same as the settings on the new server which I migrated to.
I use logwatch on both servers and I do only see the alerts so frequently on the new server.
I did already restart the apache2 more than once and I even rebooted the server but I do not see any change.

NEW:
grep -v "#" /etc/apache2/mods-available/mpm_event.conf <IfModule mpm_event_module> StartServers 2 MinSpareThreads 25 MaxSpareThreads 75 ThreadLimit 64 ThreadsPerChild 25 MaxRequestWorkers 150 MaxConnectionsPerChild 0 </IfModule>
OLD:
grep -v "#" /etc/apache2/mods-available/mpm_event.conf <IfModule mpm_event_module> StartServers 2 MinSpareThreads 25 MaxSpareThreads 75 ThreadLimit 64 ThreadsPerChild 25 MaxRequestWorkers 150 MaxConnectionsPerChild 0 </IfModule>
 

Attachments

  • log.pdf
    207 KB · Views: 1
I did check the items from your link between the old and my new server and I don't see any differences.
Thus, I suppose the whole issue is related to plesk 18 on Ubuntu 22 as opposed to plesk on Ubuntu 20.
It may also be though, that the new vServer platform has issues with the hosting server which I cannot track, as I don't have access to this.
I found a command line which gives me a summary overview on my apache service, and the old server shows even more apache requests without raising the alert.
OLD:
curl 'http://localhost/server-status' | perl -ne 'print "$1\n" if m~<td nowrap>(.*?)</td>.*</td></tr>~ ' | sort | uniq -c | sort -n % Total % Received % Xferd Average Speed Time Time Time Current Dload Upload Total Spent Left Speed 100 16822 0 16822 0 0 912k 0 --:--:-- --:--:-- --:--:-- 912k 2 plesk-service.localdomain:80 9 default:443 14 default:80 25 ps -ef | wc -l 57

NEW: curl 'http://localhost/server-status' | perl -ne 'print "$1\n" if m~<td nowrap>(.*?)</td>.*</td></tr>~ ' | sort | uniq -c | sort -n % Total % Received % Xferd Average Speed Time Time Time Current Dload Upload Total Spent Left Speed 100 10518 0 10518 0 0 1925k 0 --:--:-- --:--:-- --:--:-- 2054k 1 myDomain1.de:443 3 default:443 4 default:80 7 plesk-service.localdomain:80 10 ps -ef | wc -l 71
 
I think I eventually found the solution on HTTPS unter Apache/Ubuntu
systemctl show apache2.service | grep TasksMax
gave me a result of 60, and I did increase it to 120 with the given command:
systemctl set-property apache2.service TasksMax=120

So far the problem did not show up again.
I am still wondering, though, why my old server did not show the problem, although it also has the TaskMax set to 60.
 
Back
Top