Hi, i think that i have the same problem ...
In times to times i received this mail warnings .. but i cannot discovery what is causing that ... any help ?
Thanks in advance ...
(CentOs 6.5 with Plesk running on a VPS Server)
Server: xxxxx.
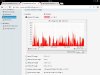
Server health parameter "CPU > Total usage" changed its status from "green" to "red".
top - 16:32:40 up 14 days, 15:16, 0 users, load average: 0.03, 0.08, 0.02
Tasks: 63 total, 2 running, 60 sleeping, 0 stopped, 1 zombie
Cpu(s): 0.0%us, 0.2%sy, 0.0%ni, 47.0%id, 52.7%wa, 0.0%hi, 0.0%si, 0.0%st
Mem: 4194304k total, 350532k used, 3843772k free, 0k buffers
Swap: 131072k total, 0k used, 131072k free, 40368k cached
PID USER PR NI VIRT RES SHR S %CPU %MEM TIME+ COMMAND
1 root 20 0 82728 62m 108 R 0.0 1.5 63:35.93 init
2 root 20 0 0 0 0 S 0.0 0.0 0:00.00 kthreadd/29938
3 root 20 0 0 0 0 S 0.0 0.0 0:00.00 khelper/29938
121 root 16 -4 10652 276 0 S 0.0 0.0 0:00.00 udevd
359 root 20 0 338m 8700 112 S 0.0 0.2 0:00.17 sw-engine-fpm
507 root 20 0 180m 4900 76 S 0.0 0.1 8:42.12 rsyslogd
548 named 20 0 311m 28m 252 S 0.0 0.7 1:20.71 named
573 root 20 0 4580 92 4 S 0.0 0.0 0:00.38 mdadm
589 dbus 20 0 21408 232 4 S 0.0 0.0 0:00.00 dbus-daemon
626 root 20 0 66612 712 0 S 0.0 0.0 0:00.01 sshd
634 root 20 0 22184 244 4 S 0.0 0.0 0:00.24 xinetd
643 root 20 0 4072 92 0 S 0.0 0.0 0:04.30 courierlogger
644 root 20 0 30300 384 8 S 0.0 0.0 0:00.67 authdaemond
652 root 20 0 4072 96 0 S 0.0 0.0 0:00.43 courierlogger
653 root 20 0 11912 164 28 S 0.0 0.0 0:00.98 couriertcpd
655 root 20 0 32404 516 8 S 0.0 0.0 0:07.87 authdaemond
656 root 20 0 32404 516 8 S 0.0 0.0 0:07.53 authdaemond
657 root 20 0 32404 516 8 S 0.0 0.0 0:07.32 authdaemond
658 root 20 0 32404 516 8 S 0.0 0.0 0:07.31 authdaemond
659 root 20 0 32404 516 8 S 0.0 0.0 0:07.65 authdaemond
666 root 20 0 4072 96 0 S 0.0 0.0 0:00.14 courierlogger
667 root 20 0 11912 168 28 S 0.0 0.0 0:00.44 couriertcpd
674 root 20 0 4072 96 0 S 0.0 0.0 0:16.75 courierlogger
675 root 20 0 11912 168 28 S 0.0 0.0 0:33.75 couriertcpd
683 root 20 0 4072 96 0 S 0.0 0.0 0:00.20 courierlogger
684 root 20 0 11912 164 28 S 0.0 0.0 0:00.25 couriertcpd
695 postfix 20 0 392m 1680 108 S 0.0 0.0 2:30.21 psa-pc-remote
793 root 20 0 11308 256 4 S 0.0 0.0 0:00.02 mysqld_safe
928 mysql 20 0 1190m 36m 2500 S 0.0 0.9 10:17.42 mysqld
1083 root 20 0 58264 888 140 S 0.0 0.0 15:45.66 master
1086 postfix 20 0 58544 964 156 S 0.0 0.0 11:07.99 qmgr
1156 root 20 0 348m 28m 2564 S 0.0 0.7 3:10.29 sw-engine
1164 root 20 0 528m 2104 92 S 0.0 0.1 11:50.70 sw-collectd
1179 root 20 0 114m 684 80 S 0.0 0.0 0:15.57 crond
1191 root 20 0 21544 184 0 S 0.0 0.0 0:00.05 atd
1210 root 20 0 4068 84 4 S 0.0 0.0 0:00.00 mingetty
1211 root 20 0 4068 84 4 S 0.0 0.0 0:00.00 mingetty
1219 root 20 0 4068 88 4 S 0.0 0.0 0:00.00 mingetty
1221 root 20 0 4068 88 4 S 0.0 0.0 0:00.00 mingetty
1223 root 20 0 4068 84 4 S 0.0 0.0 0:00.00 mingetty
1225 root 20 0 4068 84 4 S 0.0 0.0 0:00.00 mingetty
1267 postfix 20 0 58440 908 60 S 0.0 0.0 0:08.86 tlsmgr
3901 apache 20 0 329m 11m 204 S 0.0 0.3 0:00.97 httpd
6435 postfix 20 0 58344 800 72 S 0.0 0.0 0:00.13 pickup
8592 root 20 0 169m 1208 108 S 0.0 0.0 0:00.03 crond
8593 root 20 0 338m 21m 6004 S 0.0 0.5 0:00.53 sw-engine
8615 postfix 20 0 58336 812 88 S 0.0 0.0 0:00.01 anvil
8661 root 20 0 0 0 0 Z 0.0 0.0 0:00.01 mingetty <defunct>
8664 root 20 0 14896 1100 852 R 0.0 0.0 0:00.01 top
10410 apache 20 0 328m 11m 196 S 0.0 0.3 0:00.39 httpd
26710 apache 20 0 328m 12m 200 S 0.0 0.3 0:00.68 httpd
32185 root 20 0 45392 1212 0 S 0.0 0.0 0:00.00 sw-cp-serverd
32187 sw-cp-se 20 0 46208 2108 64 S 0.0 0.1 0:00.79 sw-cp-serverd
32688 root 20 0 327m 12m 1540 S 0.0 0.3 0:43.88 httpd
32690 apache 20 0 232m 6520 80 S 0.0 0.2 0:18.88 httpd
32693 apache 20 0 329m 12m 200 S 0.0 0.3 0:00.91 httpd
32694 apache 20 0 328m 11m 192 S 0.0 0.3 0:00.75 httpd
32695 apache 20 0 328m 11m 152 S 0.0 0.3 0:00.91 httpd
32696 apache 20 0 328m 11m 148 S 0.0 0.3 0:00.95 httpd
32697 apache 20 0 328m 11m 148 S 0.0 0.3 0:01.00 httpd
32698 apache 20 0 328m 11m 204 S 0.0 0.3 0:01.02 httpd
32699 apache 20 0 328m 11m 196 S 0.0 0.3 0:00.91 httpd
32700 apache 20 0 328m 11m 188 S 0.0 0.3 0:01.01 httpd
")