- Server operating system version
- AlmaLinux 8.6
- Plesk version and microupdate number
- Version 18.0.47
Hi,
I have 3 Plesk servers running AlmaLinux and 1 running Ubuntu 20.04 and all with Plesk 18.0.x.
All have the latest version of the Monitoring and Grafana extensions
Grafana Version: 1.3.4-292
Monitoring Version: 2.5.0-744
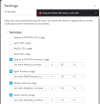
I've just discovered that saving Thresholds is broken and Plesk shows an error: "Request failed with status code 500" and no changes to Thresholds are saved. This issue occurs on all 4 servers. This means we cannot make any changes to the current thresholds and alert notifications in Plesk.
I've checked /var/log/grafana/grafana.log - but there's nothing there.
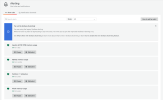
I note that there is a newer Alert system in Grafana 8+. On the Grafana Alerting -> Alert Rules page there is a message: "You are using the legacy Grafana alerting."
So maybe the current Plesk integration is broken?
Is this a known issue? Anyone else have this problem?


