• Hi, Pleskians! We are running a UX testing of our upcoming product intended for server management and monitoring.
    We would like to invite you to have a call with us and have some fun checking our prototype. The agenda is pretty simple - we bring new design and some scenarios that you need to walk through and succeed. We will be watching and taking insights for further development of the design.
    If you would like to participate, please use this link to book a meeting. We will sent the link to the clickable prototype at the meeting.
  • (Plesk for Windows):
    MySQL Connector/ODBC 3.51, 5.1, and 5.3 are no longer shipped with Plesk because they have reached end of life. MariaDB Connector/ODBC 64-bit 3.2.4 is now used instead.
  • The Horde webmail has been deprecated. Its complete removal is scheduled for April 2025. For details and recommended actions, see the Feature and Deprecation Plan.

Resolved Graphical CPU Usage Dashboard Not Loading

EnriqueR

Regular Pleskian
Server operating system version
Ubuntu 24.04.1 LTS
Plesk version and microupdate number
18.0.65
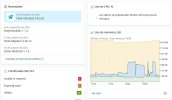
The new dashboard graph on the home page that shows CPU usage keeps loading endlessly, displaying the message 'Data will be prepared in a few minutes'.

I've tried disabling the CPU usage module, but it still doesn't appear. I've looked at Grafana's Monitoring system, but that graph does work correctly. What's more, the CPU usage doesn't work, but the memory usage below does.
 

Attachments

  • Captura.JPG
    Captura.JPG
    53.1 KB · Views: 9
Hello! The CUP information needs time to load the resources, it can take couple of minutes for first time.

Hope, it will helpful for you.
 
Hello, @EnriqueR. If you are using Grafana as a standalone extension, the issue you are experiencing is due to a bug identified with ID EXTPLESK-6085. Essentially, the data is being pulled through the Monitoring extension, so if the same is missing on the server it is normal to experience the issue. If you are using Monitoring + Grafana, please consider opening a ticket so our team can further investigate what might be causing the abnormal behavior as we are unable to reproduce it on a test environment with Ubuntu 24.04 and Plesk 18.0.65.
 
I finally found the problem. I'm telling you in case it happens to anyone else.

I installed Plesk on my server and went to the monitoring tool, which tells you that you have to install the build-in or subscribe to the 365 service. I installed the build-in. Since then I have not seen the startup graph. I guess it happens because it takes a few minutes, and if you activate the build-in service during that process, it no longer works at startup, for some reason.

Solution?? Uninstall the Monitoring extension, reinstall it and voila. Working. The start graph now appears correctly again.
 
Back
Top