Hello,
I searched on every thread on this forum but nothing helps me.
I upgraded plesk from 10.4.4 to 11.0.9, I had differents problems that are mentionned in this forum (programmed backup task not working, health monitor displaying nothing etc.).
Everything seems to work now but I have memory problems.
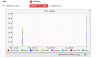
1°) On server reboot, health monitor have strange behaviours like in this thread : http://forum.parallels.com/showthread.php?t=261169
It shows me "13865731,3 %" usage of CPU. (see attached picture) After 10 minutes, it shows a correct value.
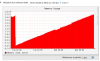
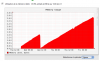
2°) From the reboot and continuously, the memory usage increase...
About 8 days after sever working, Plesk, my ssh and my server is down because of memory saturation (16Go), I have to make a hard reboot of the server.
3°) I made everything in this thread : http://forum.parallels.com/showthread.php?t=260744
My Interval in "/etc/sw-collectd/collectd.conf" is 300.
4°) Real Memory Values in health monitor interface not reflecting the ssh "top" command values and system statistics values.
In health monitor : 10.2% used (1.59 Go from 15.6 Go)
In system stats and "top" command : 11.32% used (2.28 Go form 15.58 Go)
5°) I had the same problem (memory increase) on the 10.4.4 plesk with Grsec kernel, I used the kernel without Grsec and now it still working correctly on 10.4.4. Is Grsec included on CentOS 6.2 (Final) ? if yes, is it possible to disable ?
Yesterday I rebooted the server and now my memory still increasing. (see attached picture). It will increase until my server is down and I have to reboot.
Thanks for your help.
Additional info :
CPU : GenuineIntel, Intel(R)Core(TM) i5-2400 CPU @ 3.10GHz
Version : Parallels Plesk Panel v11.0.9_build110120608.16 os_CentOS 6
OS : CentOS 6.2 (Final)
I searched on every thread on this forum but nothing helps me.
I upgraded plesk from 10.4.4 to 11.0.9, I had differents problems that are mentionned in this forum (programmed backup task not working, health monitor displaying nothing etc.).
Everything seems to work now but I have memory problems.
1°) On server reboot, health monitor have strange behaviours like in this thread : http://forum.parallels.com/showthread.php?t=261169
It shows me "13865731,3 %" usage of CPU. (see attached picture) After 10 minutes, it shows a correct value.
2°) From the reboot and continuously, the memory usage increase...
About 8 days after sever working, Plesk, my ssh and my server is down because of memory saturation (16Go), I have to make a hard reboot of the server.
3°) I made everything in this thread : http://forum.parallels.com/showthread.php?t=260744
My Interval in "/etc/sw-collectd/collectd.conf" is 300.
4°) Real Memory Values in health monitor interface not reflecting the ssh "top" command values and system statistics values.
In health monitor : 10.2% used (1.59 Go from 15.6 Go)
In system stats and "top" command : 11.32% used (2.28 Go form 15.58 Go)
5°) I had the same problem (memory increase) on the 10.4.4 plesk with Grsec kernel, I used the kernel without Grsec and now it still working correctly on 10.4.4. Is Grsec included on CentOS 6.2 (Final) ? if yes, is it possible to disable ?
Yesterday I rebooted the server and now my memory still increasing. (see attached picture). It will increase until my server is down and I have to reboot.
Thanks for your help.
Additional info :
CPU : GenuineIntel, Intel(R)Core(TM) i5-2400 CPU @ 3.10GHz
Version : Parallels Plesk Panel v11.0.9_build110120608.16 os_CentOS 6
OS : CentOS 6.2 (Final)