• Please be aware: Kaspersky Anti-Virus has been deprecated
    With the upgrade to Plesk Obsidian 18.0.64, "Kaspersky Anti-Virus for Servers" will be automatically removed from the servers it is installed on. We recommend that you migrate to Sophos Anti-Virus for Servers.
  • The Horde webmail has been deprecated. Its complete removal is scheduled for April 2025. For details and recommended actions, see the Feature and Deprecation Plan.
  • We’re working on enhancing the Monitoring feature in Plesk, and we could really use your expertise! If you’re open to sharing your experiences with server and website monitoring or providing feedback, we’d love to have a one-hour online meeting with you.

Issue High CPU usage and Swap full despite have RAM avalible

Mikelug

New Pleskian
Server operating system version
Ubuntu 20.04
Plesk version and microupdate number
Plesk Obsidian v18.0.52_build1800230516.12
Good morning, as I say in the title we have large CPU usage of our hosts, the hosts that have more traffic are Prestashop with version 1.7.8.8.8 with PHP version 7.4.33, for these hosts we use PHP FPM for Apache and Nginx as a proxy.
In addition to this we have an excessive use of SWAP, I attach a screenshot.
Our VPS has 32gb of RAM and an 8 core CPU.

What do you recommend us to do?

Thanks.

1694691697593.png
 
The first thing you should do is check the log files for bots. Keep it running for a while and check if the bot usage corresponds with the CPU usage:

Code:
# tail -f /var/www/vhosts/system/domain.com/logs/access_ssl_log /var/www/vhosts/system/domain.com/logs/proxy_access_ssl_log | grep -i bot

Or, count the number of bots in the current log files if you want to know exactly how many bots are crawling the website:
Code:
# grep -i bot /var/www/vhosts/system/domain.com/logs/access_ssl_log /var/www/vhosts/system/domain.com/logs/proxy_access_ssl_log | wc -l

The memory usage seems normal: Help! Linux ate my RAM!

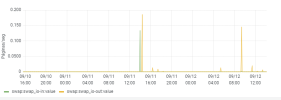
A full swap file doesn't always mean that there is an extensive usage of swap.
As soon as the graphs in Grafana show a lot of swapping throughput, you have to look into that:
Monitoring -> Memory -> Swapping throughput
Good morning, first of all thank you very much for the quick response. We have made the checks you have suggested, I will give you the results.
In the log files you tell us we have found the following amount of requests to our host with more traffic:
46678 requests that do not include the word bot and 2054 requests that contain bots, these logs are from 08:00 AM until now.
Regarding the SWAP these are the metrics:

Thank you.
1694698758338.png
 
The swap seems normal; there is nothing odd about that graph.

I'm not sure in what timezone you live, but it looks like there have been many bot requests so far.
I use this bot block list in the Additional nginx directives. Feel free to use and adapt it to your liking.
Code:
if ($http_user_agent ~* 2ip|Aport|ApacheBench|BaiduBot|Baiduspider|Birubot|BLEXBot|bsalsa|Butterfly|Buzzbot|BuzzSumo|CamontSpider|CCBot|CommentReader|colly|crazy|crawler|Crowsnest|curl|dataminr|Digincore|discobot|DomainSigma|DomainTools|Ezooms|Exabot|FairShare|Faraday|FeedFetcher|filterdb|FlaxCrawler|FlightDeckReportsBot|FlipboardProxy|FyberSpider|getintent|getprismatic|Gigabot|Go-http-client|Gulper|GrapeshotCrawler|help.jp|HTMLParser|HTTrack|ia_archiver|InfoSeek|InternetSeer|Jakarta|Java|JS-Kit|km.ru|kmSearchBot|Kraken|larbin|Leikibot|libwww|Lightspeedsystems|Linguee|LinkBot|LinkExchanger|Linkfluence|LinkpadBot|LivelapBot|LoadImpactPageAnalyzer|ltx71|lwp-trivial|majestic|meanpathbot|Mediatoolkitbot|MegaIndex|MetaURI|mfibot|MJ12bot|MLBot|musobot|NerdByNature|NING|NjuiceBot|Nuzzel|Nutch|omgili|omgilibot|OpenHoseBot|OptimizationCrawler|Panopta|paperLiBot|PaperLiBot|peerindex|petalbot|pflab|pirst|PostRank|ptd-crawler|proximic|Purebot|PycURL|Python|QuerySeekerSpider|ruby|SafeSearch|Scrapy|SearchBot|SeekportBot|semantic|Seopult|SeznamBot|SISTRIX|SiteBot|Slurp|SMTBot|Sogou|solomono|Soup|spbot|spredbot|SputnikBot|Screaming|statdom|StatOnlineRuBot|superfeedr|SurdotlyBot|SurveyBot|SWeb|TagooBot|Tagoobot|Teleport|TSearcher|ttCrawler|TurnitinBot|TweetmemeBot|Timpibot|UnwindFetchor|urllib|uTorrent|veoozbot|Voyager|WBSearchBot|Wget|WordPress|woriobot|Yeti|YottosBot|Zeus|zitebot|ZmEu|ZoominfoBot) {
    return 403;
}
 
Last edited:
The swap seems normal; there is nothing odd about that graph.

I'm not sure in what timezone you live, but it looks like there have been many bot requests so far.
I use this bot block list in the Additional nginx directives. Feel free to use and adapt it to your liking.
Code:
if ($http_user_agent ~* 2ip|Aport|ApacheBench|BaiduBot|Baiduspider|Birubot|BLEXBot|bsalsa|Butterfly|Buzzbot|BuzzSumo|CamontSpider|CCBot|CommentReader|colly|crazy|crawler|Crowsnest|curl|dataminr|Digincore|discobot|DomainSigma|DomainTools|Ezooms|Exabot|FairShare|Faraday|FeedFetcher|filterdb|FlaxCrawler|FlightDeckReportsBot|FlipboardProxy|FyberSpider|getintent|getprismatic|Gigabot|Go-http-client|Gulper|GrapeshotCrawler|help.jp|HTMLParser|HTTrack|ia_archiver|InfoSeek|InternetSeer|Jakarta|Java|JS-Kit|km.ru|kmSearchBot|Kraken|larbin|Leikibot|libwww|Lightspeedsystems|Linguee|LinkBot|LinkExchanger|Linkfluence|LinkpadBot|LivelapBot|LoadImpactPageAnalyzer|ltx71|lwp-trivial|majestic|meanpathbot|Mediatoolkitbot|MegaIndex|MetaURI|mfibot|MJ12bot|MLBot|musobot|NerdByNature|NING|NjuiceBot|Nuzzel|Nutch|omgili|omgilibot|OpenHoseBot|OptimizationCrawler|Panopta|paperLiBot|PaperLiBot|peerindex|petalbot|pflab|pirst|PostRank|ptd-crawler|proximic|Purebot|PycURL|Python|QuerySeekerSpider|ruby|SafeSearch|Scrapy|SearchBot|SeekportBot|semantic|Seopult|SeznamBot|SISTRIX|SiteBot|Slurp|SMTBot|Sogou|solomono|Soup|spbot|spredbot|SputnikBot|Screaming|statdom|StatOnlineRuBot|superfeedr|SurdotlyBot|SurveyBot|SWeb|TagooBot|Tagoobot|Teleport|TSearcher|ttCrawler|TurnitinBot|TweetmemeBot|Timpibot|UnwindFetchor|urllib|uTorrent|veoozbot|Voyager|WBSearchBot|Wget|WordPress|woriobot|Yeti|YottosBot|Zeus|zitebot|ZmEu|ZoominfoBot) {
    return 403;
}
Good, I tried to add this Nginx configuration but I get this error:

Invalid nginx configuration: nginx: [warn] protocol options overridden for 172.26.24.152:443 in /etc/nginx/plesk.conf.d/vhosts/mydomain.com. conf:7 nginx: [emerg] unexpected ";" in /var/www/vhosts/system/mydomain.com/conf/vhost_nginx.conf:3 nginx: configuration file /etc/nginx/nginx.conf test failed
You cannot use the current nginx configuration file and revert to the previous version of nginx because both contain invalid configurations.
 
- Increase Swap to 13GB (I have 32GB and this has worked for me, use is normally <3GB)

- Check your swappiness value
cat /proc/sys/vm/swappiness
I set mine to 10

- Your swap being entirely used up is a HUGE problem and if I were to guess I'd say it is bottlenecking within MariaDB/Mysql. Run the MySQL tuner script against your db and see what it recommends. It is very easy for a problematic plugin/db setup to be running queries that are joining big tables and forcing it to write to disk

- Use tools like htop and iotop and mytop the next time things slow down to get eyes on what's happening

Advanced troubleshooting: use the monthly free tier (100 gb data ingestion) of something like NewRelic (there's a plesk extension) and activate it only for PHP 7.4 and then you can, at a glance, see what happening when your load spikes (processes, specific mysql slow queries, wordpress hooks/plugins that are lagging, etc.). Also set email alerts when certain behaviours are triggered so you can monitor in real time.

If you go this route, it is important to set these 3 settings in the .ini file so you do not use up your free data within a few days.

/opt/plesk/php/7.4/etc/php.d/newrelic.ini:
newrelic.browser_monitoring.auto_instrument = true
newrelic.transaction_tracer.enabled = false
newrelic.distributed_tracing_enabled = false
 
Back
Top