• Halloween is coming! To celebrate the occasion, we dusted off a couple of old skins, and even created a brand new one (Pixel).
    To get into the festive spirit, install the Skins extension.
  • The new Python extension is now available. It allows customers to deploy and manage WSGI-based Python applications on their websites directly from Plesk.
  • The Plesk Mobile apps for iOS and Android and the Plesk Mobile Center extension have been deprecated, and are no longer available for new installations. In Plesk Obsidian 18.0.84, the Plesk Mobile Center extension will be removed from servers during the upgrade, and the Plesk Mobile apps will lose their server management features.
  • The Social Login extension has been deprecated and will be removed in Plesk Obsidian 18.0.84. After that, it will no longer be possible to log in to Plesk with a Google, Facebook, GitHub account, or with a passkey. Plesk usernames and passwords, as well as logging in with a WebPros Account, are not affected.

Question Incorrect total memory on Home dashboard after recovery

Kaspar

API expert
Plesk Guru
Server operating system version
Alma 9
Plesk version and microupdate number
Plesk 18.0.81
I recovered a backup to a different VM with different resources than the initial VM. All went well, expect that on the Home dashboard the total memory displays the memory of the older VM, rather than the actual memory available on the current VM (which is 16GB). It's a minor, cosmetic, issue of course. But I am still curious if this is solvable.
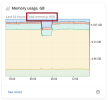
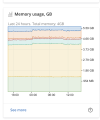
Screenshot 2026-11-02 164628.png
 
Hi Kaspar,

this also happens when you adjust a VM's memory...

Screenshot 2026-11-02 at 16.18.44.png

It would be nice to have the correct total.
Regards

LD
 
Hi Kaspar, hi LRLD,

this is a known bug in the Monitoring extension: EXTPLESK-7999, described in this KB article:

Symptom there is the same as yours: after a hardware change the widget on the home page still shows the old RAM size, and the command that is supposed to detect hardware changes doesn't fix it. The suggested workaround is to delete the Monitoring cache folder (it's only a cache, Monitoring rebuilds it):
Code:
rm -rf /usr/local/psa/var/modules/monitoring/cache

Then reload the Plesk home page (a hard refresh, Ctrl+F5, so the browser doesn't show old data). If the number is still wrong, you can try the detection command from the KB once more and look again:
Code:
plesk ext monitoring --installation --detect-hardware-changes

Two more things:
- In the screenshot the graph itself already seems to scale to the real memory, only the "Total memory" label is stale. That fits a cached hardware value and not a problem with the collected data. That's my guess from the picture, though.
- A comment under the KB article says the bug still exists in Monitoring 2.10.1, so the workaround may not work for everybody, and you may have to repeat it after every hardware change. You can check your version with:
Code:
plesk bin extension --list | grep -i monitoring

If the cache deletion doesn't help, post your Monitoring version here and mention EXTPLESK-7999 when you report it, so it ends up on the right ticket.

Regards
Tessa
 
Back
Top