zewas.digital
New Pleskian
OS: Ubuntu 20.04.3 LTS
Product: Plesk Obsidian, version 18.0.39 update #1, last updated on November 3, 2021 04:19 AM dd
Problem:
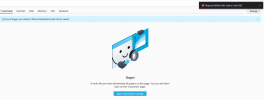
No charts are displayed in Advanced Monitoring, only the message "It looks like you have disabled all charts on this page. You can add them back on the 'Customize' page".
However, when I do this so and try to save my settings, the error message "Request failed with status code 500" is displayed.
After a little research in the logs, I found a grafana-server error:
"server grafana-server[1274]: t=2021-11-03T11:34:11+0100 lvl=eror msg="Alert Rule Result Error" logger=alerting.evalContext ruleId=9 name="Swap usage" error="request handler response error {invalid status code. status: 403 Forbidden A <nil> [] [] 0xc0005937a0}" changing state to=keep_state"
Does anyone have any advice for this problem?
Product: Plesk Obsidian, version 18.0.39 update #1, last updated on November 3, 2021 04:19 AM dd
Problem:
No charts are displayed in Advanced Monitoring, only the message "It looks like you have disabled all charts on this page. You can add them back on the 'Customize' page".
However, when I do this so and try to save my settings, the error message "Request failed with status code 500" is displayed.
After a little research in the logs, I found a grafana-server error:
"server grafana-server[1274]: t=2021-11-03T11:34:11+0100 lvl=eror msg="Alert Rule Result Error" logger=alerting.evalContext ruleId=9 name="Swap usage" error="request handler response error {invalid status code. status: 403 Forbidden A <nil> [] [] 0xc0005937a0}" changing state to=keep_state"
Does anyone have any advice for this problem?