• We value your experience with Plesk during 2024
    Plesk strives to perform even better in 2025. To help us improve further, please answer a few questions about your experience with Plesk Obsidian 2024.
    Please take this short survey:

    https://pt-research.typeform.com/to/AmZvSXkx
  • The Horde webmail has been deprecated. Its complete removal is scheduled for April 2025. For details and recommended actions, see the Feature and Deprecation Plan.
  • We’re working on enhancing the Monitoring feature in Plesk, and we could really use your expertise! If you’re open to sharing your experiences with server and website monitoring or providing feedback, we’d love to have a one-hour online meeting with you.

Resolved mysql tuning

User22123

Basic Pleskian
Dear support team, I use a server with AMD Ryzen™ 5 3600, 64 GB DDR4, NVMe SSD 512 GB and Plesk.

Are there ideal settings to increase mysql performance and achieve better performance?

If so, can you provide me with recommended settings for /etc/mysql/my.cnf

The following is currently stored

local-infile=0
innodb_buffer_pool_size=24G
skip-name-resolve=1
performance_schema=ON
query_cache_size=64M

Many thanks for the support
 
Hello Peter, I am currently testing these settings and hope they fit.

!includedir /etc/mysql/conf.d/
!includedir /etc/mysql/mariadb.conf.d/
[mysqld]
sql_mode=ERROR_FOR_DIVISION_BY_ZERO,NO_AUTO_CREATE_USER,NO_ENGINE_SUBSTITUTION
bind-address = ::ffff:127.0.0.1
local-infile=0
innodb_buffer_pool_size=24G
innodb_stats_on_metadata=0
innodb_log_file_size=64M
innodb_log_buffer_size=512M
skip-name-resolve=1
performance_schema=on
query_cache_size=0
query_cache_type=0
query_cache_limit=1M
tmp_table_size=64M
max_heap_table_size=64M
table_definition_cache=1429
key_buffer_size=24M
 
Dear Peter, dear Support Team, the mysqltuner is currently outputting the following:

[--] Skipped version check for MySQLTuner script
[OK] Currently running supported MySQL version 10.3.36-MariaDB-0+deb10u2
[OK] Operating on 64-bit architecture

-------- Log file Recommendations ------------------------------------------------------------------
[OK] Log file /var/log/mysql/error.log exists
[--] Log file: /var/log/mysql/error.log (5K)
[OK] Log file /var/log/mysql/error.log is not empty
[OK] Log file /var/log/mysql/error.log is smaller than 32 Mb
[OK] Log file /var/log/mysql/error.log is readable.
[!!] /var/log/mysql/error.log contains 1 warning(s).
[!!] /var/log/mysql/error.log contains 1 error(s).
[--] 2 start(s) detected in /var/log/mysql/error.log
[--] 1) 2023-02-14 8:51:34 0 [Note] /usr/sbin/mysqld: ready for connections.
[--] 2) 2023-02-14 8:46:20 0 [Note] /usr/sbin/mysqld: ready for connections.
[--] 2 shutdown(s) detected in /var/log/mysql/error.log
[--] 1) 2023-02-14 8:51:33 0 [Note] /usr/sbin/mysqld: Shutdown complete
[--] 2) 2023-02-14 8:46:20 0 [Note] /usr/sbin/mysqld: Shutdown complete

-------- Storage Engine Statistics -----------------------------------------------------------------
[--] Status: +Aria +CSV +InnoDB +MEMORY +MRG_MyISAM +MyISAM +PERFORMANCE_SCHEMA +SEQUENCE
[--] Data in MyISAM tables: 13.6K (Tables: 2)
[--] Data in InnoDB tables: 509.8M (Tables: 1266)
[OK] Total fragmented tables: 0

-------- Analysis Performance Metrics --------------------------------------------------------------
[--] innodb_stats_on_metadata: OFF
[OK] No stat updates during querying INFORMATION_SCHEMA.

-------- Views Metrics -----------------------------------------------------------------------------

-------- Triggers Metrics --------------------------------------------------------------------------

-------- Routines Metrics --------------------------------------------------------------------------

-------- Security Recommendations ------------------------------------------------------------------
[OK] There are no anonymous accounts for any database users
[OK] All database users have passwords assigned
[--] There are 618 basic passwords in the list.

-------- CVE Security Recommendations --------------------------------------------------------------
[OK] NO SECURITY CVE FOUND FOR YOUR VERSION

-------- Performance Metrics -----------------------------------------------------------------------
[--] Up for: 20s (2K q [106.750 qps], 52 conn, TX: 23M, RX: 480K)
[--] Reads / Writes: 98% / 2%
[--] Binary logging is disabled
[--] Physical Memory : 62.9G
[--] Max MySQL memory : 27.8G
[--] Other process memory: 0B
[--] Total buffers: 24.8G global + 19.0M per thread (151 max threads)
[--] Performance_schema Max memory usage: 104M
[--] Galera GCache Max memory usage: 0B
[OK] Maximum reached memory usage: 25.0G (39.81% of installed RAM)
[OK] Maximum possible memory usage: 27.8G (44.13% of installed RAM)
[OK] Overall possible memory usage with other process is compatible with memory available
[OK] Slow queries: 0% (0/2K)
[OK] Highest usage of available connections: 3% (5/151)
[OK] Aborted connections: 0.00% (0/52)
[OK] Query cache is disabled by default due to mutex contention on multiprocessor machines.
[OK] Sorts requiring temporary tables: 0% (0 temp sorts / 262 sorts)
[OK] No joins without indexes
[OK] Temporary tables created on disk: 15% (25 on disk / 160 total)
[OK] Thread cache hit rate: 90% (5 created / 52 connections)
[OK] Table cache hit rate: 96% (2K hits / 2K requests)
[OK] table_definition_cache (1429) is greater than number of tables (1429)
[OK] Open file limit used: 0% (59/32K)
[OK] Table locks acquired immediately: 100% (46 immediate / 46 locks)

-------- Performance schema ------------------------------------------------------------------------
[--] Performance_schema is activated.
[--] Memory used by Performance_schema: 104.0M
[--] Sys schema is not installed.

-------- ThreadPool Metrics ------------------------------------------------------------------------
[--] ThreadPool stat is disabled.

-------- MyISAM Metrics ----------------------------------------------------------------------------
[!!] Key buffer used: 18.7% (4.5M used / 24.0M cache)
[OK] Key buffer size / total MyISAM indexes: 24.0M/133.0K

-------- InnoDB Metrics ----------------------------------------------------------------------------
[--] InnoDB is enabled.
[--] InnoDB Thread Concurrency: 0
[OK] InnoDB File per table is activated
[OK] InnoDB buffer pool / data size: 24.0G / 509.8M
[OK] Ratio InnoDB log file size / InnoDB Buffer pool size: 3.0G * 2/24.0G should be equal to 25%
[OK] InnoDB buffer pool instances: 24
[--] Number of InnoDB Buffer Pool Chunk: 192 for 24 Buffer Pool Instance(s)
[OK] Innodb_buffer_pool_size aligned with Innodb_buffer_pool_chunk_size & Innodb_buffer_pool_instances
[!!] InnoDB Read buffer efficiency: 73.98% (90391 hits / 122188 total)
[OK] InnoDB Write log efficiency: 94.58% (663 hits / 701 total)
[OK] InnoDB log waits: 0.00% (0 waits / 38 writes)

-------- Aria Metrics ------------------------------------------------------------------------------
[--] Aria Storage Engine is enabled.
[OK] Aria pagecache size / total Aria indexes: 128.0M/0B
[!!] Aria pagecache hit rate: 92.1% (242 cached / 19 reads)

-------- TokuDB Metrics ----------------------------------------------------------------------------
[--] TokuDB is disabled.

-------- XtraDB Metrics ----------------------------------------------------------------------------
[--] XtraDB is disabled.

-------- Galera Metrics ----------------------------------------------------------------------------
[--] Galera is disabled.

-------- Replication Metrics -----------------------------------------------------------------------
[--] Galera Synchronous replication: NO
[--] No replication slave(s) for this server.
[--] Binlog format: MIXED
[--] XA support enabled: ON
[--] Semi synchronous replication Master: OFF
[--] Semi synchronous replication Slave: OFF
[--] This is a standalone server

-------- Recommendations ---------------------------------------------------------------------------
General recommendations:
Check warning line(s) in /var/log/mysql/error.log file
Check error line(s) in /var/log/mysql/error.log file
MySQL was started within the last 24 hours: recommendations may be inaccurate
Consider installing Sys schema from https://github.com/FromDual/mariadb-sys for MariaDB
Variables to adjust:
key_buffer_size (~ 4M)

It is entered in /etc/mysql/my.cnf


#The MariaDB configuration file
#
# The MariaDB/MySQL tools read configuration files in the following order:
# 1. "/etc/mysql/mariadb.cnf" (this file) to set global defaults,
# 2. "/etc/mysql/conf.d/*.cnf" to set global options.
# 3. "/etc/mysql/mariadb.conf.d/*.cnf" to set MariaDB-only options.
# 4. "~/.my.cnf" to set user-specific options.
#
# If the same option is defined multiple times, the last one will apply.
#
# One can use all long options that the program supports.
# Run program with --help to get a list of available options and with
# --print-defaults to see which it would actually understand and use.

#
# This group is read both both by the client and the server
# use it for options that affect everything
#
[client-server]

# Import all .cnf files from configuration directory
!includedir /etc/mysql/conf.d/
!includedir /etc/mysql/mariadb.conf.d/
[mysqld]
sql_mode=ERROR_FOR_DIVISION_BY_ZERO,NO_AUTO_CREATE_USER,NO_ENGINE_SUBSTITUTION
bind-address = ::ffff:127.0.0.1
local-infile=0
innodb_buffer_pool_size=24G
innodb_stats_on_metadata=0
innodb_log_file_size=3G
innodb_log_buffer_size=512M
skip-name-resolve=1
performance_schema=on
query_cache_size=0
query_cache_type=0
query_cache_limit=0
tmp_table_size=200M
max_heap_table_size=200M
table_definition_cache=1429

How can I prevent these join aborts and remove the remaining errors?

Many thanks for the support.
 
Can you help me pls? Thank You

Error Log:
2023-02-18 4:05:07 24053 [Warning] Aborted connection 24053 to db: 'psa' user:$
2023-02-18 5:49:01 19427 [Warning] Aborted connection 19427 to db: 'psa' user:$
2023-02-18 5:49:01 19428 [Warning] Aborted connection 19428 to db: 'psa' user:$
2023-02-18 13:33:00 26555 [Warning] Access denied for user 'admin'@'localhost' $
2023-02-18 13:33:18 26558 [Warning] Access denied for user 'admin'@'localhost' $
2023-02-18 13:36:00 0 [Note] /usr/sbin/mysqld (initiated by: unknown): Normal s$
2023-02-18 13:36:00 0 [Note] Event Scheduler: Purging the queue. 0 events
2023-02-18 13:36:00 0 [Note] InnoDB: FTS optimize thread exiting.
2023-02-18 13:36:00 0 [Note] InnoDB: Starting shutdown...
2023-02-18 13:36:00 0 [Note] InnoDB: Dumping buffer pool(s) to /var/lib/mysql/i$
2023-02-18 13:36:00 0 [Note] InnoDB: Buffer pool(s) dump completed at 230218 13$
2023-02-18 13:36:02 0 [Note] InnoDB: Removed temporary tablespace data file: "i$
2023-02-18 13:36:02 0 [Note] InnoDB: Shutdown completed; log sequence number 13$
2023-02-18 13:36:02 0 [Note] /usr/sbin/mysqld: Shutdown complete
 
Hi @User22123, sure, here are many people who are willing to help. Could you please ask a specific question? The log excerpt shows a shutdown. What is your question on it?
 
Hello Peter, the database seems very slow to me and I am therefore trying to find the reasons and to optimize them.

We use a server with AMD Ryzen™ 5 3600, 64 GB DDR4, NVMe SSD 512 GB and Plesk

A Woocommerce shop runs on it, which is quite well optimized with Wp-Rocket, Asset Clean Up,..

Nevertheless, the data processing seems very slow to me, even in the backend when I edit the product +10 seconds until the page is loaded. I have already measured everything there and deactivated blot.

so I would like to know if my database settings are correct.
#
# This group is read both both by the client and the server
# use it for options that affect everything
#
[client-server]

# Import all .cnf files from configuration directory
!includedir /etc/mysql/conf.d/
!includedir /etc/mysql/mariadb.conf.d/
[mysqld]
sql_mode=ERROR_FOR_DIVISION_BY_ZERO,NO_AUTO_CREATE_USER,NO_ENGINE_SUBSTITUTION
bind-address = ::ffff:127.0.0.1
local-infile=0
innodb_buffer_pool_size=24G
innodb_stats_on_metadata=0
innodb_log_file_size=3G
innodb_log_buffer_size=512M
skip-name-resolve=1
performance_schema=on
query_cache_size=0
query_cache_type=0
query_cache_limit=0
tmp_table_size=200M
max_heap_table_size=200M
table_definition_cache=1429

and whether I have to do something about the opera reports and Warnings?
[!!] Key buffer used: 18.7% (4.5M used / 24.0M cache)
[!!] InnoDB Read buffer efficiency: 73.98% (90391 hits / 122188 total)
[!!] Aria pagecache hit rate: 92.1% (242 cached / 19 reads)
[Warning] Aborted connection 24053 to db: 'psa' user:$
*** join_buffer_size (> 256.0K, or always use indexes with JOINs)
*** key_buffer_size (~ 4M)

Thank you very much for the help and support!
 
Your database settings are correct. Why do you think that the database is slow? How did you measure database performance? MySQL Tuner seems to suggest a different key_buffer_size, but it doesn't appear to be crucial. This will only have an effect when large data volume or request numbers are handled.

I'd guess it is rather the implementation of scripts that slow the website down. Have you considered going through articles like Why is My WooCommerce Site Slow? And How To Fix It ?
 
Hello Peter, thanks for the feedback.

It seems really slow to me a lot when the site is processing a booking.

I have already removed the scripts that are unnecessary.

I think I'll try it with Redis as well.

Thanks for the support
 
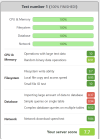
Dear Peter, I have now tested a few things. With the plugin "Hosting Benchmark tool" I got the following:

It just outputs that the following is working very slowly:

- Import large amounts of data into the database
- Simple queries on a single table

Attached is my slow error log and settings. I hope you can help me.

Setting New:

# This group is read both both by the client and the server
# use it for options that affect everything
#
[client-server]

# Import all .cnf files from configuration directory
!includedir /etc/mysql/conf.d/
!includedir /etc/mysql/mariadb.conf.d/
[mysqld]
sql_mode=ERROR_FOR_DIVISION_BY_ZERO,NO_AUTO_CREATE_USER,NO_ENGINE_SUBSTITUTION
bind-address = ::ffff:127.0.0.1
local-infile=0
innodb_buffer_pool_size=24G
innodb_stats_on_metadata=0
innodb_log_file_size=3G
innodb_log_buffer_size=512M
skip-name-resolve=1
performance_schema=on
query_cache_size=0
query_cache_type=0
query_cache_limit=0
table_definition_cache=2500
key_buffer_size=24M
innodb_buffer_pool_instances=24
thread_cache_size=600
innodb_io_capacity=15000
read_buffer_size=256K
tmp_table_size=512M
max_heap_table_size=512M
slow_query_log=1
slow_query_log_file=/var/log/mysql-slow.log
long_query_time = 2
log_output=TABLE
max_connections=800
key_buffer_size=2M

mysqldumpslow -a /var/log/mysql-slow.log
Reading mysql slow query log from /var/log/mysql-slow.log
Count: 1 Time=7.84s (7s) Lock=0.00s (0s) Rows_sent=0.0 (0), Rows_examined=1.0 (1), Rows_affected=1.0 (1), 372h1k[372h1k]@localhost
UPDATE `f5sd_options` SET `option_value` = '' WHERE `option_name` = 'rewrite_rules'

Count: 1 Time=4.21s (4s) Lock=0.00s (0s) Rows_sent=0.0 (0), Rows_examined=0.0 (0), Rows_affected=0.0 (0), …….[…….]@localhost
SELECT * FROM ……._posts WHERE ID = 9076 LIMIT 1

Count: 1 Time=4.18s (4s) Lock=0.00s (0s) Rows_sent=0.0 (0), Rows_examined=0.0 (0), Rows_affected=0.0 (0), …….[…….]@localhost
SELECT option_value FROM ……._options WHERE option_name = 'wcfm_endpoints' LIMIT 1

ount: 1 Time=3.37s (3s) Lock=0.00s (0s) Rows_sent=0.0 (0), Rows_examined=1.0 (1), Rows_affected=1.0 (1), …….[…….]@localhost
UPDATE `……._options` SET `option_value` = 'O:8:\"stdClass\":5:{s:12:\"last_checked\";i:1676904349;s:8:\"response\";a:0:{}s:12:\"translations\";a:0:{}s:9:\"no_update\";a:26:{s:27:\"wp-asset-clean-up/wpacu.php\";O:8:\"stdClass\":10:{s:2:\"id\";s:31:...........
\"wp-rocket-htaccess-remove-x-powered-by/wp-rocket-htaccess-remove-x-powered-by.php\";s:0:\"\";}}', `autoload` = 'no' WHERE `option_name` = '_site_transient_update_plugins'

Count: 1 Time=3.08s (3s) Lock=0.00s (0s) Rows_sent=0.0 (0), Rows_examined=0.0 (0), Rows_affected=0.0 (0), …….[…….]@localhost
INSERT INTO `……._actionscheduler_logs` (`action_id`, `message`, `log_date_gmt`, `log_date_local`) VALUES (171893, 'Aktion über Async Request abgeschlossen', '2023-02-20 17:51:30', '2023-02-20 18:51:30')

Count: 1 Time=2.83s (2s) Lock=0.00s (0s) Rows_sent=0.0 (0), Rows_examined=0.0 (0), Rows_affected=0.0 (0), …….[…….]@localhost
DROP TABLE `…….commentmeta`, `…….comments`, `…….links`, `…….options`, `…….postmeta`, `…….posts`, `…….termmeta`, `…….terms`, `…….term_relationships`, `…….term_taxonomy`, `…….usermeta`, `…….users`, `_mig_…….actionscheduler_actions`, `_mig_…….actionscheduler_claims`, `_mig_…….actionscheduler_groups`, `_mig_…….actionscheduler_logs`, `_mig_…….ai1ic`, `_mig_…….borlabs_cookie_consent_log`, `_mig_…….borlabs_cookie_content_blocker`, `_mig_…….borlabs_cookie_cookies`, `_mig_…….borlabs_cookie_groups`, `_mig_…….borlabs_cookie_script_blocker`, `_mig_…….borlabs_cookie_statistics`, `_mig_…….categorymeta`, `_mig_…….commentmeta`, `_mig_…….comments`, `_mig_…….easywpsmtp_debug_events`, `_mig_…….easywpsmtp_tasks_meta`, `_mig_…….ee_products_sync_list`, `_mig_…….ee_product_sync_call`, `_mig_…….ee_product_sync_data`, `_mig_…….ewwwio_images`, `_mig_…….ewwwio_queue`, `_mig_…….itsec_bans`, `_mig_…….itsec_dashboard_events`, `_mig_…….itsec_distributed_storage`, `_mig_…….itsec_fingerprints`, `_mig_…….itsec_geolocation_cache`, `_mig_…….itsec_lockouts`, `_mig_…….itsec_logs`, `_mig_…….itsec_mutexes`, `_mig_…….itsec_opaque_tokens`, `_mig_…….itsec_temp`, `_mig_…….itsec_user_groups`, `_mig_…….iwp_backup_status`, `_mig_…….iwp_processed_iterator`, `_mig_…….links`, `_mig_…….litespeed_img_optming`, `_mig_…….mailster_action_bounces`, `_mig_…….mailster_action_clicks`, `_mig_…….mailster_action_errors`, `_mig_…….mailster_action_opens`, `_mig_…….mailster_action_sent`, `_mig_…….mailster_action_unsubs`, `_mig_…….mailster_forms`, `_mig_…….mailster_forms_lists`, `_mig_…….mailster_forms_tags`, `_mig_…….mailster_form_fields`, `_mig_…….mailster_links`, `_mig_…….mailster_lists`, `_mig_…….mailster_lists_subscribers`, `_mig_…….mailster_queue`, `_mig_…….mailster_subscribers`, `_mig_…….mailster_subscriber_fields`, `_mig_…….mailster_subscriber_meta`, `_mig_…….mailster_tags`, `_mig_…….mailster_tags_subscribers`, `_mig_…….options`, `_mig_…….pmxe_exports`, `_mig_…….pmxe_google_cats`, `_mig_…….pmxe_posts`, `_mig_…….pmxe_templates`, `_mig_…….postmeta`, `_mig_…….posts`, `_mig_…….product_catmeta`, `_mig_…….revslider_css`, `_mig_…….revslider_css_bkp`, `_mig_…….seopress_significant_keywords`, `_mig_…….sparkle_wedl_licenses`, `_mig_…….sparkle_wedl_licenses_meta`, `_mig_…….sparkle_wedl_licenses_renew_meta`, `_mig_…….storeabill_documentmeta`, `_mig_…….storeabill_documents`, `_mig_…….storeabill_document_itemmeta`, `_mig_…….storeabill_document_items`, `_mig_…….storeabill_document_noticemeta`, `_mig_…….storeabill_document_notices`, `_mig_…….storeabill_journals`, `_mig_…….termmeta`, `_mig_…….terms`, `_mig_…….term_relationships`, `_mig_…….term_taxonomy`, `_mig_…….tm_taskmeta`, `_mig_…….tm_tasks`, `_mig_…….usermeta`, `_mig_…….users`, `_mig_…….viwec_clicked`, `_mig_…….wc_admin_notes`, `_mig_…….wc_admin_note_actions`, `_mig_…….wc_category_lookup`, `_mig_…….wc_customer_lookup`, `_mig_…….wc_download_log`, `_mig_…….wc_order_addresses`, `_mig_queue_failures`, `_mig_queue_jobs`, `_mig_wpmdb_alter_statements`

Count: 1 Time=2.61s (2s) Lock=0.00s (0s) Rows_sent=0.0 (0), Rows_examined=1.0 (1), Rows_affected=1.0 (1), …….[…….]@localhost
DELETE FROM `……._options` WHERE `option_name` = '_site_transient_theme_roots'

Count: 1 Time=2.53s (2s) Lock=0.00s (0s) Rows_sent=0.0 (0), Rows_examined=0.0 (0), Rows_affected=0.0 (0), …….[…….]@localhost
DROP TABLE ……._postmeta

Count: 1 Time=2.09s (2s) Lock=0.00s (0s) Rows_sent=0.0 (0), Rows_examined=1000.0 (1000), Rows_affected=1000.0 (1000), …….[…….]@localhost
DELETE FROM _mig_queue_jobs LIMIT 1000
 

Attachments

  • Screenshot 2023-02-21 082714.png
    Screenshot 2023-02-21 082714.png
    152.3 KB · Views: 24
I'd guess it is rather the implementation of scripts that slow the website down. Have you considered going through articles like Why is My WooCommerce Site Slow? And How To Fix It ?
I'd like to once again point your attention to this. If there is an "issue" at all, it is very likely not caused by database configuration settings.

It is really kind of you that you share the information above, but it does not lead anywhere. What transactions were done? When were they done? It could be that the slow-log-entries are the accumulated entries from the past year. It is also possible that the disk I/O load was high at the given time, e.g. because other transactions like a backup or compression was ongoing. It could be that indices are missing from tables so that the database needs a lot of time to seek a certain dataset. It could be that many idices are present so that building a new index after an import of many datasets takes a while. And what would be a satisfying output of the Benchmark for you? A 9.9 everywhere? The "Hosting Benchmark Tool" you are using is a Wordpress plugin. Execution depends on your Wordpress configuration and performance. Only if you had the same configuration with the same data on another machine you could compare the two installations. But as a stand-alone measurement it has no meaning. It will also be required that no other processes are being handled while a test is done, else the other processes will have load on the cpu, database, disk I/O.
 
Hello Peter, thanks for the feedback. The logs are new, I will test objectcache with redis, maybe that will help.
Many thanks for the great support
 
@User22123

If this

innodb_buffer_pool_size=24G

is indeed a setting of 24G on a 64G server, then it is no surprise that your SERVER (not WordPress or WooCommerce in specific) is slow.

@Peter Debik already mentioned some potential explanations, but the 24G value is the clear indicator that all of his assumptions should be confirmed.

In essence, it is recommended to return to the default MySQL config (as provided by Plesk) and then FIRST tune WordPress (not Woocommerce), for instance by giving the WP site a bit more memory.

Go back to basics and work towards a solution with simple steps - it should be a process of elimination, not by thinking that MySQL is guilty (even though not yet proven to be guilty).

Kind regards....
 
Hello Trialotto, thank you for your feedback.

I set the innodb_buffer_pool_size= to 2GB.

I use WP Rocket, Asset Clean Up and php 8.1 and all unnecessary resources have already been unloaded and the cache has also been optimized.

I'm still cautious about Redis and Memcached or ngnix cache because I don't have any experience.

Some say set the ngnix cache to 2GB and 24 hours, others to 64M with 1 minute.

I'm very grateful for every tip.

Best regards
 
@User22123

There you have it : WP Rocket, Asset Clean Up etc ...... all on the Apache level, hence creating extra workloads for the memory hungry Apache web server.

This is what I call a "design flaw" - you did not think of the infrastructure that fits your goals and objectives best.

Nginx as a reverse proxy is powerful, in the sense that it can help reduce the load upon on the resource hungry Apache server.

But when using Nginx, something like WP Rocket becomes meaningless : they did not tell you that!

Using Nginx with Redis (always to be preferred!) might be a good setup, but also an overkill, since Nginx has some default options for caching.

The problem here is that you say "I do not have experience ...... " and that should also apply to caching in general.

In essence, each site requires its own fine-tuning, when it comes to caching (and again, WP Rocket does not tell you that).

It is just a process of trial-and-error : just switch on the default Nginx caching in Plesk and load the webpages in question, in order to have a look at the http requests and in order to establish which requests are cached and - more important - which requests are not cached.

You should then focus on the request that are not cached and make sure that you tweak config in such a way that they are cached - with the exception of very specific requests : you shoud never cache authentication related requests or requests aiming at specific directories, such as wp-admin with WordPress.

In most case, the Plesk default config can suffice.

However, some annoying cookies - even those of Google Analytics - can cause a failure to cache specific requests : just allow Nginx to ignore them for caching purposes (and again, this can be easily done by analyzing http requests from the browser and add a string in the Plesk Panel).

I hope it helps a bit!

Kind regards....


PS I cannot really give you a full and complete answer, since it has been a long debate with Plesk Team on which Nginx config settings should be applied by default. As a result, tweaking Nginx cache related config is a bit more difficult and always suboptimal, unless you manually add some directives per domain. Nevertheless, even without the manually additions, the Plesk Nginx Cache works relatively fine, out-of-the-box. Just try!
 
Hello, thank you very much for the feedback. Yes, unfortunately we need some plugins that load unnecessary resources.

I will look at all this and try to improve.

Thanks for the support
 
In essence, it is recommended to return to the default MySQL config (as provided by Plesk)

Hello, can you write the "default MySQL config "as provided by Plesk".

I did some changes in my.cnf and i want to revert back to my previous config....

Thank you
 
Plesk does not provide, neither changes my.cnf, because that is part of your database server. If you experience issues with your database, please open your own, new thread and describe the issue. It will also be helpful to show other users on the forum the content of your /etc/my.cnf file as it is now, so that they can give advice on what looks wrong. Please do not hijack other threads for new issues.
 
Back
Top