• If you are still using CentOS 7.9, it's time to convert to Alma 8 with the free centos2alma tool by Plesk or Plesk Migrator. Please let us know your experiences or concerns in this thread:
    CentOS2Alma discussion

Panel memory usage eating up 3gig of ram

David_Br

New Pleskian
Hello,

Plesk server is eating up all the ram, cannot see where the problem is:

Panel memory usage 84.3% used (3.09 GB of 3.66 GB) (?)

Server is at AWS, Intel(R) Xeon(R) CPU E5645 @ 2.40GHz, 3.7 GB of memory.

Furthermore, since the "Panel memory usage" is that high, i receive tons of email for "not responding and restarted" like below:
The Plesk Web Server service on host host.adoraweb.com.br is down.
The problem was discovered on Feb 4, 2013 12:15 PM.

Any idea?
Many thanks!
David
 
Have you tried to troubleshoot it somehow? Any logs, error messages, etc? Have you read any recommendations about memory consumption in KB articles or on this forum?
 
Hello,

At first i tought i was a configuration problem, so as it was a test server on AWS i have scratched it and created a new one.

m1.medium instance
CPU GenuineIntel, Intel(R) Xeon(R)CPU E5645 @ 2.40GHz
Version Parallels Plesk Panel v11.0.9_build110120608.16 os_RedHat el6
OS CloudLinux Server 6.3
RAM 3.7 GB

Now, after a few hours of (very light) use of this server, Plesk Health Monitoring reports the following:
Panel memory usage
29% used (1.06 GB of 3.66 GB) 2.21 (?)
see attached graph

[root@ip-10-0-0-160 psa]# top
top - 11:23:32 up 2:27, 1 user, load average: 0.00, 0.02, 0.00
Tasks: 186 total, 1 running, 185 sleeping, 0 stopped, 0 zombie
Cpu(s): 0.0%us, 0.0%sy, 0.0%ni,100.0%id, 0.0%wa, 0.0%hi, 0.0%si, 0.0%st
Mem: 3837524k total, 2517132k used, 1320392k free, 77284k buffers
Swap: 0k total, 0k used, 0k free, 620436k cached

[root@ip-10-0-0-160 psa]# free -m
total used free shared buffers cached
Mem: 3747 2458 1289 0 75 605
-/+ buffers/cache: 1776 1970
Swap: 0 0 0


Could you please help?
Many thanks,
David
 

Attachments

  • host.adoraweb.com.br.png
    host.adoraweb.com.br.png
    19.5 KB · Views: 6
Since then i have rebooted the server.
Nothing changed.
After a few minutes this Panel process is still eating up ram:

Panel memory usage
21.5% used (808 MB of 3.66 GB) (?)

But a new (funny) issue came into Health Monitoring for CPU usage

Total usage
22667842.2% used 4946191.44 (?)

FYI:
[root@host ~]# top
top - 14:24:40 up 13 min, 1 user, load average: 0.06, 0.04, 0.02
Tasks: 111 total, 1 running, 110 sleeping, 0 stopped, 0 zombie
Cpu(s): 0.0%us, 0.3%sy, 0.0%ni, 99.7%id, 0.0%wa, 0.0%hi, 0.0%si, 0.0%st
Mem: 3837524k total, 703736k used, 3133788k free, 22768k buffers
Swap: 0k total, 0k used, 0k free, 304076k cached

[root@host ~]# free -m -t
total used free shared buffers cached
Mem: 3747 777 2970 0 23 301
-/+ buffers/cache: 452 3295
Swap: 0 0 0
Total: 3747 777 2970
 
Dear Igor,

By pure coincidence, i found one of your very old posts related to PSA9.5
http://forum.parallels.com/pda/index.php/t-107160.html

I think i have exactly the same issue with PSA 11.0.9

[root@host sw-cp-server]# ps aux | grep sw-engine-cgi | wc -l
257

-some process, very long list-
psaadm 42549 0.0 0.4 327152 18784 ? S 18:26 0:01 /usr/bin/sw-engine-cgi -c /usr/local/psa/admin/conf/php.ini -d auto_prepend_file=auth.php3 -u psaadm
psaadm 42550 0.0 0.5 331264 22692 ? S 18:26 0:01 /usr/bin/sw-engine-cgi -c /usr/local/psa/admin/conf/php.ini -d auto_prepend_file=auth.php3 -u psaadm
psaadm 42934 0.0 0.1 216368 4464 ? Ss 18:37 0:00 /usr/bin/sw-engine-cgi -c /usr/local/psa/admin/conf/php.ini -d auto_prepend_file=auth.php3 -u psaadm
psaadm 42951 0.1 0.6 329048 24452 ? S 18:37 0:02 /usr/bin/sw-engine-cgi -c /usr/local/psa/admin/conf/php.ini -d auto_prepend_file=auth.php3 -u psaadm
psaadm 42952 0.0 0.6 328784 25436 ? S 18:37 0:00 /usr/bin/sw-engine-cgi -c /usr/local/psa/admin/conf/php.ini -d auto_prepend_file=auth.php3 -u psaadm
psaadm 42953 0.0 0.6 328008 24628 ? S 18:37 0:00 /usr/bin/sw-engine-cgi -c /usr/local/psa/admin/conf/php.ini -d auto_prepend_file=auth.php3 -u psaadm
psaadm 43166 0.0 0.3 216368 14904 ? Ss 19:09 0:00 /usr/bin/sw-engine-cgi -c /usr/local/psa/admin/conf/php.ini -d auto_prepend_file=auth.php3 -u psaadm
psaadm 43183 0.0 0.3 316608 12612 ? S 19:09 0:00 /usr/bin/sw-engine-cgi -c /usr/local/psa/admin/conf/php.ini -d auto_prepend_file=auth.php3 -u psaadm
psaadm 43184 0.0 0.1 216368 4712 ? S 19:09 0:00 /usr/bin/sw-engine-cgi -c /usr/local/psa/admin/conf/php.ini -d auto_prepend_file=auth.php3 -u psaadm
psaadm 43185 0.0 0.1 216368 4712 ? S 19:09 0:00 /usr/bin/sw-engine-cgi -c /usr/local/psa/admin/conf/php.ini -d auto_prepend_file=auth.php3 -u psaadm
root 43222 0.0 0.0 6388 728 pts/0 S+ 19:13 0:00 grep sw-engine-cgi


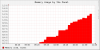
And Health Monitoring reports:
Panel memory usage
86.3% used (3.16 GB of 3.66 GB) 1.03 (?)
Real memory usage
95.8% used (3.51 GB of 3.66 GB) 1.01 (?)

I tried to fix it, but i found no occurences of "max-procs" or "min-procs" in the config files
Where are they ?
How can i fix this ?

Many thanks,
David
 
5 minutes later, even more processes...

[root@host sw-cp-server]# ps aux | grep sw-engine-cgi | wc -l
261
 
As possible solution you can try to set value "min-procs" to 1 or 2 in /etc/sw-cp-server/applications.d/plesk.socket.sh and restart psa service after that.
 
Yep, it's what i found a few hours before your post.
Since then i haven't had any memory issues.

Maybe a thing to fix in future releases ?

David
 
Back
Top