• If you are still using CentOS 7.9, it's time to convert to Alma 8 with the free centos2alma tool by Plesk or Plesk Migrator. Please let us know your experiences or concerns in this thread:
    CentOS2Alma discussion
  • Please beaware of a breaking change in the REST API on the next Plesk release (18.0.62).
    Starting from Plesk Obsidian 18.0.62, requests to REST API containing the Content-Type header with a media-type directive other than “application/json” will result in the HTTP “415 Unsupported Media Type” client error response code. Read more here

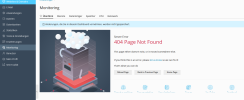
Issue Plesk Monitoring PlugIn 404 Page Not Found

quattro123

Basic Pleskian
Hi,

I am getting this error when I start the monitoring plugin.
I already deleted and re-installed monitoring as well as grafana plugins.

Can anybody help me? What could cause such an issue?

greetings!

1645986568720.png
 
Hi quattro123,

The mentioned article is applicable only in the case of "360 Monitoring"; in the case of "Built-in Monitoring" mode (with Grafana graphs), Safari as any other supported browser should work without additional steps. Based on the screenshot, it is a Built-in Monitoring.

Back to the issue, never heard about an issue like this before.
Could you please provide more data about OS, Plesk, Monitoring, and Grafana extensions, Grafana version (as a software)? I also suggest contacting the Plesk Support team to investigate what is wrong.


P.S. I have tried to reproduce the issue but on my server, everything works with Safari as well as Google Chrome. Needs more details.
 
Hey,

here the data:

OS: Debian 10, 64 bit
Monitoring and Grafana both the recent versions available in plesk

1646160246040.png
 
Back
Top