• Debian 11 is approaching its end-of-life (vendor EOL date - August 31, 2026). Plesk Obsidian 18.0.80 will be the last release to support it.
    If you are running Plesk Obsidian on Debian 11, we recommend you upgrade those servers to Debian 12 using our dist-upgrade tool.
  • We plan to deprecate and remove the support for XML RPC protocol versions earlier than 1.6.9.1 in Plesk Obsidian 18.0.82. We strongly recommend that you update all existing integrations using earlier versions of the XML RPC protocol to comply with the version 1.6.9.1 specification.

Issue Plesk Monitoring PlugIn 404 Page Not Found

quattro123

Basic Pleskian
Hi,

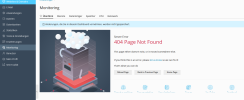
I am getting this error when I start the monitoring plugin.
I already deleted and re-installed monitoring as well as grafana plugins.

Can anybody help me? What could cause such an issue?

greetings!
1645986568720.png
 
Hi quattro123,

The mentioned article is applicable only in the case of "360 Monitoring"; in the case of "Built-in Monitoring" mode (with Grafana graphs), Safari as any other supported browser should work without additional steps. Based on the screenshot, it is a Built-in Monitoring.

Back to the issue, never heard about an issue like this before.
Could you please provide more data about OS, Plesk, Monitoring, and Grafana extensions, Grafana version (as a software)? I also suggest contacting the Plesk Support team to investigate what is wrong.


P.S. I have tried to reproduce the issue but on my server, everything works with Safari as well as Google Chrome. Needs more details.
 
Hey,

here the data:

OS: Debian 10, 64 bit
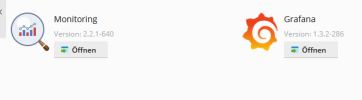
Monitoring and Grafana both the recent versions available in plesk

1646160246040.png
 
Back
Top