• We value your experience with Plesk during 2024
    Plesk strives to perform even better in 2025. To help us improve further, please answer a few questions about your experience with Plesk Obsidian 2024.
    Please take this short survey:

    https://pt-research.typeform.com/to/AmZvSXkx
  • The Horde webmail has been deprecated. Its complete removal is scheduled for April 2025. For details and recommended actions, see the Feature and Deprecation Plan.
  • We’re working on enhancing the Monitoring feature in Plesk, and we could really use your expertise! If you’re open to sharing your experiences with server and website monitoring or providing feedback, we’d love to have a one-hour online meeting with you.

Issue Rare upstream timeout issues on a new system

Winnstorm

Basic Pleskian
Hello,

I've installed a new connection (asim 100dw / 10up) and a server that I've recently installed centos 7 with plesk obsidian. After migrating 5 domains (low traffic websites) the sites become not responsive, almost all attempts failing with 504 gateway timeout / upstream timed out (110: connection timed out) while reading response header from upstream on log files.

I've applied nginx timeout policies to 180s without any positive change. Server cpu/mem/io load are ok. I don't understand if this is related to network upstream or something like that.

This is speedtest output:

Retrieving speedtest.net configuration...
Testing from Cablevision Argentina (190.17.90.217)...
Retrieving speedtest.net server list...
Selecting best server based on ping...
Hosted by Telecom Argentina (Ramos Mejia) [10.26 km]: 18.913 ms
Testing download speed................................................................................
Download: 92.17 Mbit/s
Testing upload speed................................................................................................
Upload: 10.85 Mbit/s

On this network I've another server that its working fine, with 3 websites and mail servers no issues.

Any help on where the issue could be??

Thanks
best regards
 
  • Like
Reactions: Hex
This has nothing to do with the line speed. It's more something like Fail2Ban blocking your local IP because it was not added to the white list of Fail2Ban. So first check to do: Have you added your server's local IPs to the Fail2Ban whitelist? (Tools & Settings > Security > IP Address Banning > Trusted IP Addresses)

Another reason could be that your websites are using PHP-FPM and that daemon fails. Details will be available in the error_log files of the corresponding subscriptions.
Hello!
Thanks for your answer, I have verified fail2ban config and the server local and public address are added in the list.

On the websites log files I only see this error very frequently and some access logs mixed (for the success cases in the case that website loads). Just to make sure to explain better this case, sometime randomly websites starts to load after several refresh attempts of the same page.

Some other things to mention that I have added on the server post plesk installation are ddosdeflate and mod evasive. I think that its not related with them because the error on website logs are quite different if these particular errors of nginx.
 
  • Like
Reactions: Hex
The errors occur in Nginx, because Nginx is waiting on a response from Apache that never comes. But he cause is that Apache is not responding. If this is not due to a blocked IP address, it could be due to a ModSecurity jail block. You can check your error_logs for the error code given. You should also look into the process status of your Apache web server when it is not responding. Maybe it failed?
# service httpd status
or
# service apache2 status
(depending on your operating system).
 
I don't think that its failing, but I se some service restarts (I installed watchdog extension of plesk). Please note that this is a brand new installation of centos 7 and plesk so system remain untouch and the service are plesk default of oneclick installation. I only added mod_evasive, ddos_deflate and 4 additional php handlers: php versions 7.4 (plesk default one) / 7.2 / 7.1 / 5.6 and 5.4

httpd.service - The Apache HTTP Server
Loaded: loaded (/usr/lib/systemd/system/httpd.service; enabled; vendor preset: disabled)
Drop-In: /usr/lib/systemd/system/httpd.service.d
└─respawn.conf
Active: active (running) since jue 2020-11-05 01:15:47 -03; 11h ago
Docs: man:httpd(8)
man:apachectl(8)
Process: 802 ExecReload=/usr/sbin/httpd $OPTIONS -k graceful (code=exited, status=0/SUCCESS)
Main PID: 11236 (httpd)
Status: "Total requests: 0; Current requests/sec: 0; Current traffic: 0 B/sec"
CGroup: /system.slice/httpd.service
├─ 1110 /usr/sbin/httpd -DFOREGROUND
├─ 1111 /usr/sbin/httpd -DFOREGROUND
├─ 1112 /usr/sbin/httpd -DFOREGROUND
├─ 1140 /usr/sbin/httpd -DFOREGROUND
├─ 1168 /usr/sbin/httpd -DFOREGROUND
├─ 1204 /usr/sbin/httpd -DFOREGROUND
├─11236 /usr/sbin/httpd -DFOREGROUND
└─20736 /usr/sbin/httpd -DFOREGROUND

nov 05 01:30:35 systemd[1]: Reloading The Apache HTTP Server.
nov 05 01:30:35 systemd[1]: Reloaded The Apache HTTP Server.
nov 05 01:31:24 systemd[1]: Reloading The Apache HTTP Server.
nov 05 01:31:24 systemd[1]: Reloaded The Apache HTTP Server.
nov 05 01:31:57 systemd[1]: Reloading The Apache HTTP Server.
nov 05 01:31:58 systemd[1]: Reloaded The Apache HTTP Server.
nov 05 01:32:29 systemd[1]: Reloading The Apache HTTP Server.
nov 05 01:32:29 systemd[1]: Reloaded The Apache HTTP Server.
nov 05 03:18:00 systemd[1]: Reloading The Apache HTTP Server.
nov 05 03:18:00 systemd[1]: Reloaded The Apache HTTP Server.
 
  • Like
Reactions: Hex
Reloads are not critical. Restarts are. So when you see "reloading", normally there is no interruption in service for the website.

"On the websites log files I only see this error very frequently and some access logs mixed (for the success cases in the case that website loads)."
What exactly is shown in the logs?
 
Here I attach a log of one of the websites that its facing this issue (mainly all websites are based on wordpress):

As you can see some minutes before website was loading just fine, then suddenly it started to fail with the upstream error:

2020-11-05 19:43:25Access108.162.210.104200GET /wp-content/uploads/2019/06/cropped-favicon-piola.png?x=wccp_pro_watermark_pass HTTP/1.1
Unknown
37.5 Knginx SSL/TLS access
2020-11-05 19:43:27Access198.41.231.175301GET /wp-content/uploads/2019/06/cropped-favicon-piola-32x32.png HTTP/1.0
https://tangobytes.com/vader-immortal-episode-i-descargar-gratis/
Mozilla/5.0 (Windows NT 10.0; Win64; x64) AppleWebKit/537.36 (KHTML, like Gecko) Chrome/86.0.4240.183 Safari/537.36
861Apache SSL/TLS access
2020-11-05 19:43:27Access198.41.230.124200GET /wp-content/plugins/wccp-pro/watermark.php?&src=/wp-content/uploads/2019/06/cropped-favicon-piola-32x32.png&w=1 HTTP/1.0
https://tangobytes.com/vader-immortal-episode-i-descargar-gratis/
Mozilla/5.0 (Windows NT 10.0; Win64; x64) AppleWebKit/537.36 (KHTML, like Gecko) Chrome/86.0.4240.183 Safari/537.36
1.66 KApache SSL/TLS access
2020-11-05 19:43:49Access173.245.54.163200GET /tag/space-space/ HTTP/1.0
Mozilla/5.0 (compatible; SemrushBot/6~bl; +http://www.semrush.com/bot.html)
165 KApache SSL/TLS access
2020-11-05 19:44:01Access141.101.105.228200GET / HTTP/1.0
Wget/1.14 (linux-gnu)
230 KApache SSL/TLS access
2020-11-05 19:45:03Error162.158.106.16813362#0: *35422 upstream timed out (110: Connection timed out) while connecting to upstreamnginx error
2020-11-05 19:45:14Error162.158.74.23711628#0: *35430 upstream timed out (110: Connection timed out) while connecting to upstreamnginx error
2020-11-05 19:45:21Error172.69.63.20911628#0: *35436 upstream timed out (110: Connection timed out) while connecting to upstreamnginx error
 
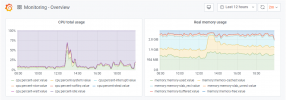
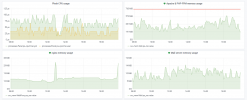
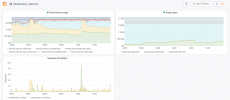
Here I attach grafana views. Another rare thing is that plesk panel work flawless, very fast (also when websites are not loading) not the case of the websites hosted on it.

Watchdog:
1604617283792.png

Grafana:

1604616833612.png

1604616867675.png
1604616894457.png
1604616914456.png
1604616933935.png
 
I'm facing the same issue on a checkout page, tried everything, this is a challenge to figure out the root case.
The freaking error:
Code:
3853#0: *152 upstream timed out (110: Connection timed out) while reading response header from upstream
 
It's almost always caused by an unresponsive script, e.g. a script that ends up in an infinite rewrite loop or a while...next loop that does not reach the exit condition. If it affects the same page as you are writing, it's an indication that this is indeed caused by the script that delivers the page. Does it wait on an external source that does not deliver the data it needs to complete rendering the page? Is it caught in a rewrite trap of a URL that is requests?
 
  • Like
Reactions: Hex
Finally found it,

It's complicated to debug and simple to fix and somehow stupid.

Open the necessarily mail port used by your script 25,110,465,587 if you're using the cloud or Firewalld.

I've return the nonsense limits solutions to default Nginx settings and it's faster than 300ms.

The problem is, all solution about this error is about excessive use of the webserver but not 1 post on the web about the conflict of unresponsive script as mentioned by Peter.

In my case the checkout response is usually a confirmation message with order# but instead of that I get 504 badegatway after 30-60 seconds, because the PHPmailer is trying to send the confirmation email and return a response to the webserver but he never did because of the blocked port needed by the script.

because Nginx is waiting on a response from Apache that never comes. But he cause is that Apache is not responding. If this is not due to a blocked IP address

In my maillog I found the failed attempt to send an email but that should not stop Nginx from serving the next page in line.

@Winnstorm sorry to interrupt your thread.

Check if this is your case, if not, take a look at your low traffic websites and make sure there are no scripts need a port to be open.

Nginx and Apache are working fine without any custom parameters.
 
Thanks for explaining the details. It is always good to put the solution into a thread, too, so that others can learn from that.

Actually, Nginx is not really waiting on a port response from email. As you describe it, PHP is waiting on that response which does not come, then exists (or does something), but at least does not continue to render the page, so that Apache does not have anything to report to Nginx. This again obviously has caused the timeout.

Many users have seen similar issues before, I think it is a very valuable approach to also look at responses from ports and not only other scripts or file resources. I'll consider this in future support requests here with similar issues.
 
Back
Top