• If you are still using CentOS 7.9, it's time to convert to Alma 8 with the free centos2alma tool by Plesk or Plesk Migrator. Please let us know your experiences or concerns in this thread:
    CentOS2Alma discussion

Issue remove grafana by hand

wschoener

New Pleskian
Hi there,
some days before christmas grafana did not work any more. It did not show any graphics, but it show up a error.
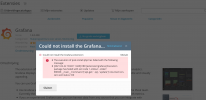
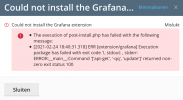
So I tried to uninstall it, in the hope to reinstall it afterwards. The uninstallation did not work. I tried to uninstall it by using ssl, but this did not work either.
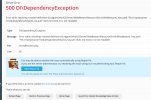
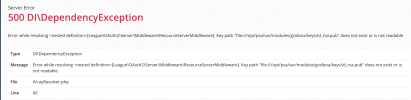
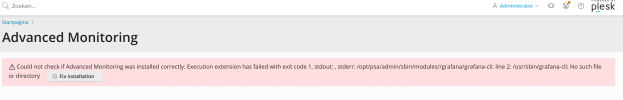
Grafana is still in Plesk but "Advanced Monitoring" doesnt show any information. When I call "extensions->myextensions-grafana->open" there is a white page and the title of the page is "server error".
Sometimes there is a message:
The execution off post-install.php failed. Error-message: [2021-01-14 08:30:42.808] ERR [extension/grafana] Execution package has failed with exit code 1, stdout: , stderr: ERROR:__main__:Command '['apt-get', '-qq', 'update']' returned non-zero exit status 100

So I would like to remove grafana by hand. How can I do this?
Thank you
Wolfgang
 
Have you tried to use a command like:

# dpkg -r --force-all grafana

?
 
Hi @IgorG & wschoener, I have the same error:

The execution off post-install.php failed. Error-message: [2021-01-14 08:30:42.808] ERR [extension/grafana] Execution package has failed with exit code 1, stdout: , stderr: ERROR:__main__:Command '['apt-get', '-qq', 'update']' returned non-zero exit status 100
And I tried to resolve it but with no success, I deleted grafana from the extensions menu and reinstalled it again but with no success, I was left with ^ error.

I tried Igor his # dpkg -r --force-all grafana But this also did not help since when I try to install it again, the same error pops up.
Any tips and should I use --Purge to make it all clean?
Kind regards!
 

Attachments

  • Shot 2021-02-22 om 18.37.40.png
    Shot 2021-02-22 om 18.37.40.png
    91.4 KB · Views: 8
Oh, at this point without purging but stil after I tried # dpkg -r --force-all grafana, I now am not able to install grafana anymore as seen on screenshot 1.
But when I checked into my extensions after a refresh, I see grafana in my extensions list. When clicking on it, it gives me the same error (screenshot 2) and I am stuck from here:D.
 

Attachments

  • 2.png
    2.png
    264.3 KB · Views: 12
  • 1.png
    1.png
    320.2 KB · Views: 11
When I go to the advanced monitoring tab It gives this error so the directory never was made. When clicking fix this issue I will make the loop complete. Still no solution..
 

Attachments

  • Shot 2021-02-22 om 20.45.25.png
    Shot 2021-02-22 om 20.45.25.png
    58.5 KB · Views: 4
In the meantime I deleted and reinstalled Advanced monitoring to and that did work but after that the same grafana error came back..
I searched for the folder that is mentioned in the error and found out the whole Grafana folder is empty?
/opt/psa/var/modules/grafana shows no files.
 

Attachments

  • Shot 2021-02-22 om 22.34.27.png
    Shot 2021-02-22 om 22.34.27.png
    149.9 KB · Views: 4
After deleting advanced monitor and grafana for the 2352 time and waited a couple of days I get this error back again.
 

Attachments

  • Shot 2021-02-24 om 18.40.47.png
    Shot 2021-02-24 om 18.40.47.png
    93.3 KB · Views: 6
What is the output of command:

# netstat -ntpl | grep :3000

?
 
hi @IgorG Meanwhile deleted the (faultily installed) advanced monitor and grafana, dropped your command in the SHH and no output:(
 
Today I tried to reinstall Advanced monitoring again and hope it will take Grafana with it in the download but too bad.
It does give a clean new error to work with, any suggestions?
 

Attachments

  • Shot 2021-02-27 om 21.01.57.png
    Shot 2021-02-27 om 21.01.57.png
    111.9 KB · Views: 2
Updated debian 8 to 9 and tried all over again, still no success after following this topic and steps:

still getting this error time after time:

ERR [extension/grafana] The execution of post-install.php has failed with the following message:
[2021-03-03 18:54:13.671] ERR [extension/grafana] Execution package has failed with exit code 1, stdout: , stderr: ERROR:__main__:Command '['apt-get', '-qq', 'update']' returned non-zero exit status 100
The execution of post-install.php has failed with the following message:
[2021-03-03 18:54:13.671] ERR [extension/grafana] Execution package has failed with exit code 1, stdout: , stderr: ERROR:__main__:Command '['apt-get', '-qq', 'update']' returned non-zero exit status 100
 
I suppose that you have to contact the Plesk Support Team. Experienced support guys will check and fix the issue directly on your server.
 
Thanks for the reply @IgorG I'm running a couple of plesk licences @OVH how do I contact plesk, can I give my OVH-Plesk licence as a proof or must it be directly bought @ plesk? I use plesk for 4/5 years now and never had to contact support so I'm not sure how to do this.
 
Just a question? is your plesk panel running in a Debian 8 server?
One of mine has exactly the same problem, it has not been migrated to a new OS yet...
 
Back
Top