• If you are still using CentOS 7.9, it's time to convert to Alma 8 with the free centos2alma tool by Plesk or Plesk Migrator. Please let us know your experiences or concerns in this thread:
    CentOS2Alma discussion

server crash

Imad S

New Pleskian
Hey,

A webserver i run goes down at least once a week. The day it goes down isn't fixed, it usually was a Friday but it went down today, Thursday.

I'm sure it's not a hardware issue because I've moved this property across 3 servers in the past 12 months and they all experience this crash.

Server Config:
Plesk 12
Nginx
PHP-FPM
Percona 5.6

Intel Xeon E5-2620
32GB DDR4 ECC RAM
2 x 2TB 7200RPM HDD's
 
Any results of your investigation? Related error messages in logs, etc? What did you do for troubleshooting?
 
So far logs don't appear to report anything pointing to a crash. Everything appears to be fine and then just a void until the server comes back online

This is a screenshot of newrelic around the time the server went down.

 
Last edited:
Hi Imad S,

and this is an empty plate, with some crumbs:

leerer-teller.jpg

Can you tell what I ate? ( sorry for the joke... but I really couldn't resist this time )


Your image is nice, but it will not help to investigate issues/problems/errors on your server, just with some really tiny informations like:

Server Config:
Plesk 12
Nginx
PHP-FPM
Percona 5.6

Intel Xeon E5-2620
32GB DDR4 ECC RAM
2 x 2TB 7200RPM HDD's
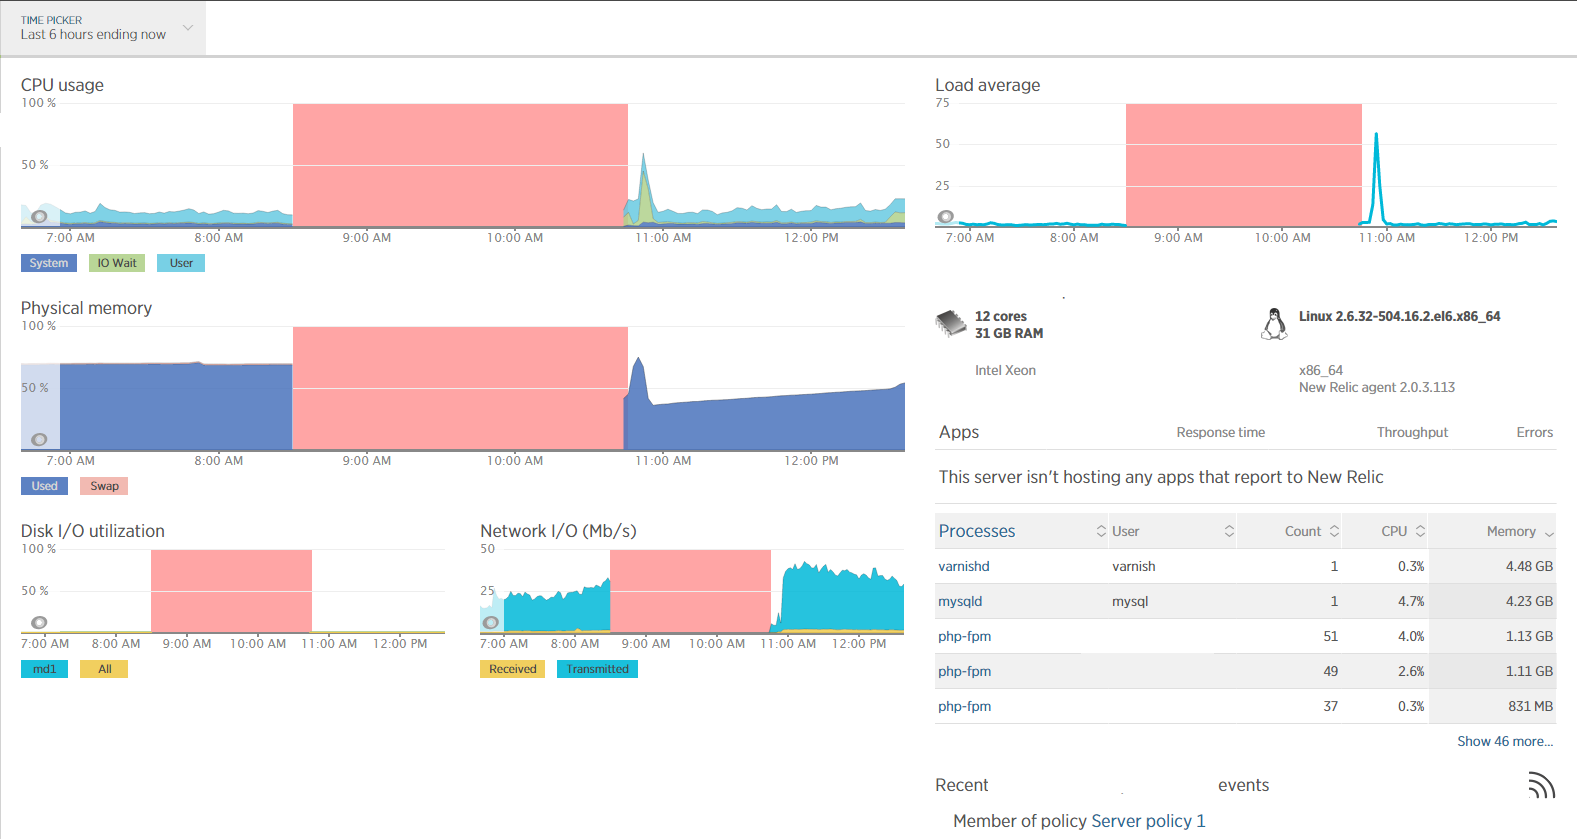

We really can't guess, what the cause of an issue/problem/error might be on a server... there are far too many reasons, why this could happen. There MUST be something in your logs, why your issue/problem/error appears and newrelic made it a bit easier for you to investigate it, because it tells you the approximate time, around which your issue/problem/error takes place. Now it's YOUR turn, to investigate in your logs, what's happening around this time on your server. If you need help with your investigations, please post depending errors from your logs, so that people willing to help you, could push you into the right direction, what you could do to solve your issue(s)/problem(s).
 
Hi Imad S,

and this is an empty plate, with some crumbs:

View attachment 10086

Can you tell what I ate? ( sorry for the joke... but I really couldn't resist this time )


Believe me, I understand how vague my situation is. You have no idea the kind of s*** I get from my boss for not having been able to solve this.


I'm currently looking at the error logs of the usual suspects: nginx, php-fpm and /var/log/messages. What else should I be looking at?
 
At very high level, does it start responding on its own or do you manually need to intervene? Are you able to access the panel while the issue occurs? If you've moved the site between installations (versus moving both the installations and the site) this could point to a very aggressive bot or traffic load combined with errant code or poorly designed code which often makes its presence known during spikes in traffic.
 
At very high level, does it start responding on its own or do you manually need to intervene? Are you able to access the panel while the issue occurs? If you've moved the site between installations (versus moving both the installations and the site) this could point to a very aggressive bot or traffic load combined with errant code or poorly designed code which often makes its presence known during spikes in traffic.

No, I have to manually reboot the server. Note: A software reboot does the trick.

I cannot access the panel while the issue occurs.

So far, the downtime has never occurred in peak hours, always in off-peak. We've also correlated Google Analytics with the downtime and there were no occurrences of traffic spikes followed by crashes.
 
What ends up in your syslog? Particularly /var/log/messages or /var/log/kern depending on syslog setup. Should be some errors there. Does the host of your server have a method for you to access the console of the system before initiating the reboot? If something caused the kernel to panic, it will still be visible on the console even if it wasn't able to be logged to disk (due to i/o issues, etc.).

Or, perhaps something about memory issues like this shows up in your logs:

Aug 27 04:49:45 server kernel: Out of memory: Kill process 1423 (sort) score 867 or sacrifice child

If this is occurring in off peak hours, I can tell you one thing I've run into on many Plesk servers; it's the fact that they combine the web logs using the 'sort' command with in-memory sorting, so if you have any very busy sites on the server, it may run the server out of memory and make it crash. We have some clients who can not use any webstats or logging because they won't fix this bug; I had to create cron jobs to remove their logs before the nightly rotation to ensure Plesk doesn't try to 'sort' a 40 gigabyte file in memory. Here's a thread on it:

http://talk.plesk.com/threads/webst...to-sort-command-on-access_log-webstat.325220/

Thank you for that, that's the first solid lead I've had in months.


Based on the thread you linked, I looked at the /var/www/vhosts/system/ folders but the biggest folder was 500mb, on a server with 32GB RAM i doubt that's what causing downtimes for me. Plus I didn't see the cron you mentioned on my server, Plesk 12.

While looking at the cronjobs I found the following:

Code:
0       1       *       *       1       /usr/local/psa/libexec/modules/watchdog/cp/secur-check
0       1       *       *       1       /usr/local/psa/libexec/modules/watchdog/cp/send-report weekly
10      1       *       *       *       /usr/local/psa/libexec/modules/watchdog/cp/clean-sysstats
15      1       *       *       *       /usr/local/psa/libexec/modules/watchdog/cp/pack-sysstats day
15      1       *       *       1       /usr/local/psa/libexec/modules/watchdog/cp/pack-sysstats week
15      1       1       *       *       /usr/local/psa/libexec/modules/watchdog/cp/pack-sysstats month
15      1       1       *       *       /usr/local/psa/libexec/modules/watchdog/cp/pack-sysstats year
20      1       *       *       *       /usr/local/psa/libexec/modules/watchdog/cp/clean-events
0       3       *       *       7       /usr/local/psa/libexec/modules/watchdog/cp/clean-reports

How can I figure out the cron with week at the end isn't causing the issue? I tried accessing the plesk-sysstats file but it appears to be encrypted.
 
Last edited:
Those should be fine. You could turn off watchdog's weekly/monthly tasks if you wanted; you can find it under Extensions.

Was there anything interesting in your syslogs from the kernel?
 
Back
Top