• We value your experience with Plesk during 2024
    Plesk strives to perform even better in 2025. To help us improve further, please answer a few questions about your experience with Plesk Obsidian 2024.
    Please take this short survey:

    https://pt-research.typeform.com/to/AmZvSXkx
  • The Horde webmail has been deprecated. Its complete removal is scheduled for April 2025. For details and recommended actions, see the Feature and Deprecation Plan.
  • We’re working on enhancing the Monitoring feature in Plesk, and we could really use your expertise! If you’re open to sharing your experiences with server and website monitoring or providing feedback, we’d love to have a one-hour online meeting with you.

Issue Swap Usage Threshold Exceeded

Will-NYESDigital

Regular Pleskian
Hi all,

Please see below the issue I am having:

PRODUCT, VERSION, OPERATING SYSTEM, ARCHITECTURE
Plesk Obsidian Version 18.0.37 Update #2, last updated on Aug 11, 2021 03:25 AM - CentOS Linux 8.4.2105 (Core)

PROBLEM DESCRIPTION
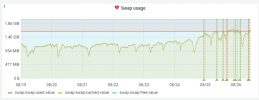
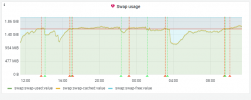
I have received multiple alerts from Advanced Monitoring advising me that the Swap Usage threshold has exceeded and does not seam to be going down anytime soon.

STEPS TO REPRODUCE
Went into the Notifications on plesk and also can see the graph in advanced monitoring very high.

ACTUAL RESULT
The issue is then going over the threshold we have in place due to me having only 2GB of usage available - there is 85.99% in use which needs sorting or increasing.

EXPECTED RESULT
The the swap usage is similar to another core server we have way beneath the threshold line.

ANY ADDITIONAL INFORMATION

Screenshot for the high readings is attached.

I have checked the log files on the server and cannot see any times that match up to the alerts.

Thanks for your time.
 

Attachments

  • 1-week-risen.png
    1-week-risen.png
    43 KB · Views: 15
  • past-24-hours.png
    past-24-hours.png
    36.7 KB · Views: 16
Purpose of the monitoring is not to keep swap space down, but to notify the user if it is intensively used above a given threshold. If your system uses a lot of swap space, it will be very important to add more RAM. It is not necessarily the web server that needs the RAM, but it can also be PHP processes, the database server and maybe even the mail server. How big is your RAM?
 
Purpose of the monitoring is not to keep swap space down, but to notify the user if it is intensively used above a given threshold. If your system uses a lot of swap space, it will be very important to add more RAM. It is not necessarily the web server that needs the RAM, but it can also be PHP processes, the database server and maybe even the mail server. How big is your RAM?
Hi Peter

Thank you for your response.

I am aware that this is a notifier and we just need to get the swap usage down to stop the warnings.

The ram is a total of 2GB which can be seen in the attached image, do you recommend increasing this and if so how?
 

Attachments

  • RAM-Usage-Server1.png
    RAM-Usage-Server1.png
    9.6 KB · Views: 10
2 GB is very low. You cannot decrease swap usage if services require more RAM to work. You will need to ask your provider to upgrade your system with more RAM.
 
2 GB is very low. You cannot decrease swap usage if services require more RAM to work. You will need to ask your provider to upgrade your system with more RAM.
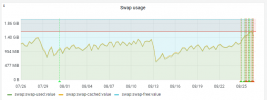
I don't understand though how the swap usage has been fine as long as I've known and all of a sudden it has gone up in the past week, please see screenshot - how do you advise looking into this as I have checked the log files and the times/dates don't match up?
 

Attachments

  • 1-month-swap-usage.png
    1-month-swap-usage.png
    41.4 KB · Views: 7
You need to sign on to the Linux console of your sever and analyze which process is using how much RAM by checking the process list. From there you might want to dig deeper and check what the processes that use all the RAM are actually doing.
 
Hi @Peter Debik and @mow - after undertaking a server restart to apply updates etc the swap usage went back to normal again, however we have noticed that the advanced monitoring graph is showing signs of it increasing again which we understand to be MYSQL related. Can you advise where we can find the MYSQL log file and support us please?
 
You can find the location of the logfile in /etc/my.cnf :

[mysqld_safe]
log-error=/var/log/mariadb/mariadb.log

I always use this script to check the memory usage, it also has a swap option:

Thank you for the suggestion however I have checked the maria.db file and there are only a couple of lines in there.
 
But please have a look at the ps_mem.py script before you start debugging the mysqld. It might be something else that's causing the swap usage.

Just run the script like this:
python ps_mem.py --swap

or install it from the rpm of deb package.
 
Hi All. Thank you for your support on this, we rebuilt the server and upgraded our RAM to 8GB and will monitor the alerts from here on.

Thanks all for the help once again.
 
Back
Top