- Server operating system version
- Debian 12
- Plesk version and microupdate number
- Plesk Obsidian v18.0.57_build1800231208.08 os_Debian 12.0
Hi, I just installed a new dedicated server with Plesk and something is puzzling me.
It is a new installation, the domain has no traffic and WordPress is installed.
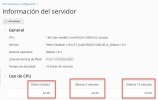
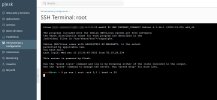
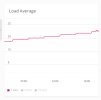
The average load goes up and up and doesn't seem to stop at any value. I have seen it with a value of 40. I have restarted the server and the same thing happens again, it goes up little by little.
It is also true that everything seems to be going well, I can visit the domain in the browser, I can enter the WordPress admin and everything seems correct and loads quickly.
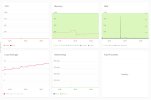
The values for CPU, Memory, Disk, Networking... are all at a minimum since, as I said before, the domain has no traffic. I only have a monitoring tool connected to detect possible falls (UptimeRobot).
Should I worry about this? Is it a Plesk bug?

