• Hi, Pleskians! We are running a UX testing of our upcoming product intended for server management and monitoring.
    We would like to invite you to have a call with us and have some fun checking our prototype. The agenda is pretty simple - we bring new design and some scenarios that you need to walk through and succeed. We will be watching and taking insights for further development of the design.
    If you would like to participate, please use this link to book a meeting. We will sent the link to the clickable prototype at the meeting.
  • The Horde webmail has been deprecated. Its complete removal is scheduled for April 2025. For details and recommended actions, see the Feature and Deprecation Plan.
  • The ImunifyAV extension is now deprecated and no longer available for installation.
    Existing ImunifyAV installations will continue operating for three months, and after that will automatically be replaced with the new Imunify extension. We recommend that you manually replace any existing ImunifyAV installations with Imunify at your earliest convenience.

Resolved The tab content cannot be loaded because the Grafana service is stopped. Start the service?

weareimpulse

Basic Pleskian
Server operating system version
Ubuntu 22.04.5 LTS
Plesk version and microupdate number
Plesk Obsidian 18.0.67 Update #2 Web Host Edition
hi, has anyone has this... since a server restart, Grafana in plesk wont work... started by saying dashboard not found, i followed a few posts on here in an attempt to fix it, not i just get this message...

The tab content cannot be loaded because the Grafana service is stopped. Start the service?

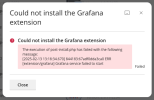
when I click start service, i get this error:

An error occurred while starting the Grafana service: Execution extension has failed with exit code 1, stdout: , stderr: [2025-02-12 12:16:37.149] 68184:67ac90da22ab6 ERR [extension/grafana] Synchronous restart of the Grafana service failed: Grafana service failed to startGrafana service failed to start
 
hi, i did see that and tried it, however, i get this output on SSH...

grafana is already the newest version (11.5.1).
The following packages were automatically installed and are no longer required:
grub-pc-bin libc6-i386 libcurl4-openssl-dev
Use 'apt autoremove' to remove them.
0 upgraded, 0 newly installed, 0 to remove and 1 not upgraded.

So not sure what to do now :(
 
Thank you for the confirmation. I am unable to reproduce the issue on a test environment. Could you please check the logs for more details:

journalctl -u grafana-server.service --no-pager | tail -n 100
cat /var/log/syslog | grep "Feb 13" | grep grafana
 

Attachments

  • Screenshot 2025-02-13 at 13.18.46.png
    Screenshot 2025-02-13 at 13.18.46.png
    43.5 KB · Views: 3
i've tried the full removal suggestion, including monitoring, and reinstalled everything via the plesk extension shop feature, and i now get this message:

The execution of post-install.php has failed with the following message:
[2025-02-14 15:04:24.200] 1804049:67af5b77c2959 ERR [extension/grafana] Execution filemng has failed with exit code 1, stdout: filemng: /bin/ln execution failed:
/bin/ln: failed to create symbolic link '/usr/share/grafana/data': No such file or directory
, stderr: filemng: /bin/ln execution failed:
/bin/ln: failed to create symbolic link '/usr/share/grafana/data': No such file or directory
 
Thank you for the confirmation, @weareimpulse . So, it still looks like Grafana is installed from Grafana's repository rather than Plesk's. Before you perform any of the below changes, please make sure you have a backup, just in case.

What you can do is:

  1. Move the Grafana repository file:
    mv /etc/apt/sources.list.d/grafana.list /root/
  2. Run apt update:
    apt update
  3. Follow the steps from this article.
I hope that helps.
 
Back
Top