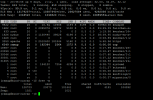
top - 19:47:46 up 6 days, 1:13, 2 users, load average: 32.10, 32.20, 32.16
Tasks: 413 total, 1 running, 412 sleeping, 0 stopped, 0 zombie
%Cpu(s): 99.9 us, 0.1 sy, 0.0 ni, 0.0 id, 0.0 wa, 0.0 hi, 0.0 si, 0.0 st
KiB Mem : 13179257+total, 10435160+free, 23533640 used, 3907324 buff/cache
KiB Swap: 1046520 total, 1046520 free, 0 used. 10716766+avail Mem
PID USER PR NI VIRT RES SHR S %CPU %MEM TIME+ COMMAND
16266 root 20 0 8892864 3416 748 S 3187 0.0 7035:47 kswapd0
1682 root 20 0 2095076 32468 5096 S 1.0 0.0 54:52.22 fail2ban-server
22626 psaadm 20 0 505584 23760 13468 S 1.0 0.0 1:17.27 sw-engine-fpm
241 root 20 0 0 0 0 S 0.3 0.0 9:27.34 kworker/31:1
1626 nydus 20 0 1130440 38956 6196 S 0.3 0.0 25:44.03 nydus-ex-api
2305 root 20 0 0 0 0 S 0.3 0.0 1:14.76 kworker/11:2
2461 mysql 20 0 1431880 115192 9500 S 0.3 0.1 31:26.51 mysqld
2861 root 20 0 0 0 0 S 0.3 0.0 0:00.07 kworker/8:1
2866 ramup 20 0 162364 2564 1572 R 0.3 0.0 0:00.24 top
2876 root 20 0 0 0 0 S 0.3 0.0 0:00.05 kworker/10:0
3272 root 20 0 5149180 30452 7924 S 0.3 0.0 3:15.03 PassengerAgent
3668 grafana 20 0 2636364 64452 18060 S 0.3 0.0 15:01.55 grafana-server
6684 root 20 0 0 0 0 S 0.3 0.0 2:29.15 kworker/18:1
9911 root 20 0 0 0 0 S 0.3 0.0 0:18.81 kworker/0:1
10214 root 20 0 0 0 0 S 0.3 0.0 7:05.19 kworker/30:2
13498 root 20 0 0 0 0 S 0.3 0.0 0:20.19 kworker/17:0
13684 root 20 0 0 0 0 S 0.3 0.0 0:18.21 kworker/14:2
14979 root 20 0 0 0 0 S 0.3 0.0 0:18.23 kworker/15:2
24801 root 20 0 0 0 0 S 0.3 0.0 0:21.38 kworker/19:0
28630 root 20 0 0 0 0 S 0.3 0.0 0:06.33 kworker/3:2
29340 root 20 0 0 0 0 S 0.3 0.0 0:01.25 kworker/20:1
31843 root 20 0 0 0 0 S 0.3 0.0 0:03.29 kworker/29:2
32723 root 20 0 0 0 0 S 0.3 0.0 0:02.50 kworker/9:1
1 root 20 0 194120 7236 4216 S 0.0 0.0 3:01.44 systemd
2 root 20 0 0 0 0 S 0.0 0.0 0:00.87 kthreadd
4 root 0 -20 0 0 0 S 0.0 0.0 0:00.00 kworker/0:0H
6 root 20 0 0 0 0 S 0.0 0.0 0:02.06 ksoftirqd/0
7 root rt 0 0 0 0 S 0.0 0.0 0:00.25 migration/0
8 root 20 0 0 0 0 S 0.0 0.0 0:00.00 rcu_bh
9 root 20 0 0 0 0 S 0.0 0.0 5:46.10 rcu_sched
10 root 0 -20 0 0 0 S 0.0 0.0 0:00.00 lru-add-drain
11 root rt 0 0 0 0 S 0.0 0.0 0:02.21 watchdog/0
12 root rt 0 0 0 0 S 0.0 0.0 0:01.83 watchdog/1
13 root rt 0 0 0 0 S 0.0 0.0 0:00.02 migration/1
14 root 20 0 0 0 0 S 0.0 0.0 0:00.23 ksoftirqd/1
16 root 0 -20 0 0 0 S 0.0 0.0 0:00.00 kworker/1:0H
18 root rt 0 0 0 0 S 0.0 0.0 0:01.78 watchdog/2