• Our team is looking to connect with folks who use email services provided by Plesk, or a premium service. If you'd like to be part of the discovery process and share your experiences, we invite you to complete this short screening survey. If your responses match the persona we are looking for, you'll receive a link to schedule a call at your convenience. We look forward to hearing from you!
  • We are looking for U.S.-based freelancer or agency working with SEO or WordPress for a quick 30-min interviews to gather feedback on XOVI, a successful German SEO tool we’re looking to launch in the U.S.
    If you qualify and participate, you’ll receive a $30 Amazon gift card as a thank-you. Please apply here. Thanks for helping shape a better SEO product for agencies!
  • The BIND DNS server has already been deprecated and removed from Plesk for Windows.
    If a Plesk for Windows server is still using BIND, the upgrade to Plesk Obsidian 18.0.70 will be unavailable until the administrator switches the DNS server to Microsoft DNS. We strongly recommend transitioning to Microsoft DNS within the next 6 weeks, before the Plesk 18.0.70 release.
  • The Horde component is removed from Plesk Installer. We recommend switching to another webmail software supported in Plesk.

Issue Apache CPU load peaks then all sites in 504

Zalem Citizen

New Pleskian
Hello,

My Plesk is hosting about 140 websites. Some very small and with few visitors, some larger, with lots of static content, all on cms like wordpress and a few drupal, and cron tasks.

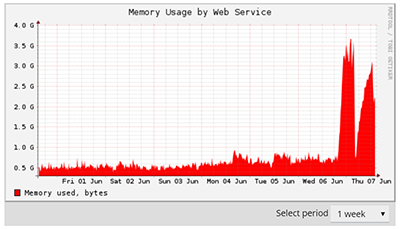
Site visits increase each year on summer so we are entering a heavy duty period.
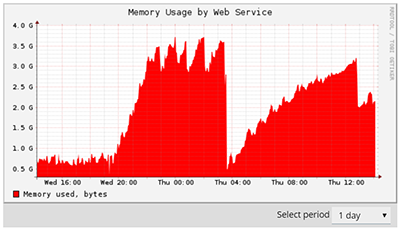
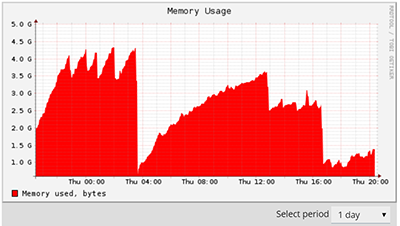
For a few days, server randomly fails : apache cpu usage increases dramatically and the server answers with 504 time out. No memory outage, disks I/O seems ok.
Server is an Ubuntu 16.04 running multiple version of PHP (mainly 5.6 and 7.1) through FPM. MySQL is running locally.

Last time was reported by my uptime monitors yesterday at 20:55.

apache-cpu-peak.jpg


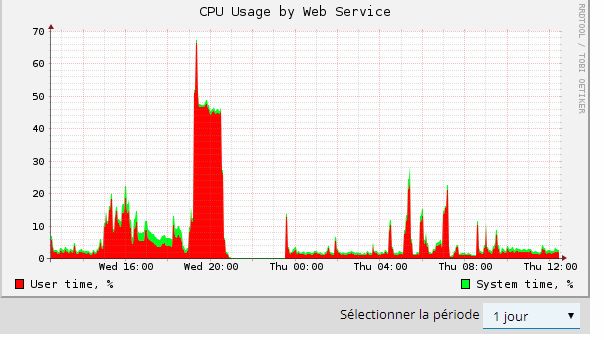
Health monitor is showing a peak in Apache CPU round 19:15-25, then a lot of sleeping processes.
Syslog shows this :
Jun 6 19:24:19 <hostname> systemd[1]: Stopping User Manager for UID 10006...
Jun 6 19:24:19 <hostname> systemd[19718]: Stopped target Default.
Jun 6 19:24:19 <hostname> systemd[19718]: Stopped target Basic System.
Jun 6 19:24:19 <hostname> systemd[19718]: Stopped target Paths.
Jun 6 19:24:19 <hostname> systemd[19718]: Stopped target Sockets.
Jun 6 19:24:19 <hostname> systemd[19718]: Stopped target Timers.
Jun 6 19:24:19 <hostname> systemd[19718]: Reached target Shutdown.
Jun 6 19:24:19 <hostname> systemd[19718]: Starting Exit the Session...
Jun 6 19:24:19 <hostname>systemd[19718]: Received SIGRTMIN+24 from PID 21716 (kill).
Jun 6 19:24:19 <hostname> systemd[1]: Stopped User Manager for UID 10006.
But I can't figure if it could be related or not.

Apache log shows this, just before all websites went down :
[Wed Jun 06 20:51:43.107882 2018] [mpm_prefork:error] [pid 29055] AH00161: server reached MaxRequestWorkers setting, consider raising the MaxRequestWorkers setting

So I checked apache modules and saw mpm_prefork is running.
Shouldn't it be running mpm_event instead to multithread and forward requests efficiently to PHP-FPM through FastCGI ?
Could it be the origin of my problem ?

Thanks !
 
My guess is that the problem originates from brute force attacks or DoS attacks like Wordpress XML-RPC pingbacks to websites that quickly become too many for the server to cope with the increating load. In a high load situation, it can be helpful to identify the websites that are consuming most CPU load, e.g.
# watch "ps aux | sort -nrk 3,3 | head -n 20"
Then go into their access_log and error_log to find the reason why Apache is so busy.
 
I have a similar setup to the OP, although I'm using CentOS.

I'm here for the same reason. Since yesterday Apache keeps using more and more resources until I have to reboot the server.

apache1.png


Here, for comparison, is what Apache normally looks like...

apache2.png


I am watching what processes are running as per @Peter Debik's suggestion and will report back anything that I learn.
 
Long story short, I ended up blocking about 14 IP addresses, mostly from Indonesia, that were hammering one of the accounts on my server. I don't know if it was a DoS attack, a brute force attempt, or what... but it seems that my issue has been resolved.

apache3.png


@Zalem Citizen I recommend checking your access logs.
 
Thanks for your answers.
In my case, I found long time running fpm processes for non wordpress websites. But indeed it can be attacks.

@Peter Debik thanks for your command. Though I can't figure why ps aux was showing me that some processes are using an amount of CPU (30%, 20%, ..) they don't use really (htop command reports a different amount, Plesk health monitor does not match either. Is it normal ?

@stevland do you have an easy way to find attacks in access logs ? I mean, there's a massive amount of data in there, not easy to notice if something's wrong is happening

Note : I don't have such increasing and repeating activity in memory consumption. It seems that my Apache is occupied by long time processes, kept sleeping a long time after they finished to eat CPU then it reachs MaxRequestWorkers (that I doubled from 150 to 300) then go down
 
Last edited:
I found that my MaxConnectionsPerChild was set to 0 for mpm_prefork .
Since it seems to me that some apache child processes don't die, I set it to 1000 (according to Woktron Web Hosting) cause I'm unable to calculate (total amount of daily requests / total number of daily processes).
Any thought about that ?
 
@EmmanuelD thanks
Does that option replace normal access logs in each hosting or does it just add a central log ?

Each domain will continue to have its individual log file but additionally to that you'll have a central log file (/var/log/httpd/access_log for CentOS/RHEL or /var/log/apache2/access.log for Debian/Ubuntu).

You can then for example set up fail2ban to monitor this central log file and block failed WordPress login attempts as described here: How To Protect Your WordPress With Fail2Ban
 
I found that my MaxConnectionsPerChild was set to 0 for mpm_prefork .
Since it seems to me that some apache child processes don't die, I set it to 1000 (according to Woktron Web Hosting) cause I'm unable to calculate (total amount of daily requests / total number of daily processes).
Any thought about that ?

Sounds reasonable to me, we do that too. This is mostly to prevent any memory leaks that might occur with Apache child processes.
 
Back
Top