• If you are still using CentOS 7.9, it's time to convert to Alma 8 with the free centos2alma tool by Plesk or Plesk Migrator. Please let us know your experiences or concerns in this thread:
    CentOS2Alma discussion

Apache memory leak / usage problem

IanJ

New Pleskian
Apache memory leak/usage problem

I have two servers. The first is a physical server with 2GB total RAM running Plesk 9.3.0. The second is a virtual server with 2.2GB total RAM running Plesk 10.1.1 (latest version).

I have never had any problems with memory on the first server running 9.3.0—and have been running and upgrading Plesk for years on that server.

My virtual server was commissioned a year ago and is hosted by VPS.NET. I originally put Plesk 9 on it, but upgraded to 10 when it was released last year. Since the Plesk 10 upgrade I am having constant problems with Apache consuming memory.

Here are the ps | grep httpd results from each server.

First, the physical server running Plesk 9:

apache 3408 0.0 0.7 39136 14572 ? S Feb04 0:46 /usr/sbin/httpd
apache 3411 0.0 0.8 43272 18332 ? S Feb04 0:45 /usr/sbin/httpd
apache 3412 0.0 0.7 39164 14592 ? S Feb04 0:43 /usr/sbin/httpd
root 4991 0.0 0.6 33980 13892 ? Ss Feb04 0:00 /usr/sbin/httpd
apache 5000 0.0 0.2 24052 4736 ? S Feb04 0:00 /usr/sbin/httpd
apache 5001 0.0 0.7 40204 16020 ? S Feb04 1:00 /usr/sbin/httpd
apache 5002 0.0 0.8 43544 18580 ? S Feb04 0:51 /usr/sbin/httpd
apache 5003 0.0 0.7 40204 15988 ? S Feb04 0:57 /usr/sbin/httpd
apache 5004 0.0 0.6 39124 13772 ? S Feb04 0:58 /usr/sbin/httpd
apache 5005 0.0 0.8 43044 18472 ? S Feb04 0:59 /usr/sbin/httpd
apache 5006 0.0 0.8 43540 18584 ? S Feb04 0:57 /usr/sbin/httpd
apache 5007 0.0 0.8 43008 18084 ? S Feb04 0:58 /usr/sbin/httpd
apache 5008 0.0 0.7 40436 15716 ? S Feb04 0:58 /usr/sbin/httpd
apache 6023 0.0 0.9 43552 18972 ? S Feb04 0:53 /usr/sbin/httpd
apache 7627 0.0 0.7 40472 15516 ? S Feb04 0:39 /usr/sbin/httpd

Secondly, the virtual server running Plesk 10:

root 1483 0.0 0.8 432824 19956 ? Ss Feb04 0:00 /usr/sbin/httpd
apache 1497 0.0 0.2 217692 5556 ? S Feb04 0:00 /usr/sbin/httpd
apache 1504 0.0 6.3 574048 146792 ? S Feb04 0:13 /usr/sbin/httpd
apache 1505 0.0 5.9 570996 138492 ? S Feb04 0:14 /usr/sbin/httpd
apache 1506 0.0 5.5 559684 129044 ? S Feb04 0:14 /usr/sbin/httpd
apache 1507 0.0 5.9 569972 138600 ? S Feb04 0:13 /usr/sbin/httpd
apache 1510 0.0 6.6 580212 154548 ? S Feb04 0:15 /usr/sbin/httpd
apache 1511 0.0 5.8 567924 135116 ? S Feb04 0:13 /usr/sbin/httpd
apache 1513 0.0 6.0 566880 139076 ? S Feb04 0:16 /usr/sbin/httpd
apache 1514 0.0 5.6 563828 130144 ? S Feb04 0:14 /usr/sbin/httpd
apache 1517 0.0 5.2 554596 120388 ? S Feb04 0:12 /usr/sbin/httpd
apache 1566 0.0 5.4 560756 126604 ? S Feb04 0:13 /usr/sbin/httpd
apache 1568 0.0 5.1 552564 118872 ? S Feb04 0:12 /usr/sbin/httpd
apache 1620 0.0 5.8 567924 134244 ? S Feb04 0:13 /usr/sbin/httpd
apache 7928 0.0 4.2 545356 98100 ? S Feb04 0:05 /usr/sbin/httpd
apache 9728 0.0 1.8 495200 41740 ? S 00:08 0:02 /usr/sbin/httpd

You will see on the second virtual server running Plesk 10 each httpd process is consuming on average 6% of memory, whilst on the first physical server running Plesk 9 each process only consumes an average less than 1% of memory.

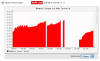
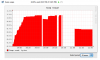
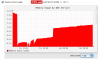
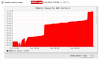
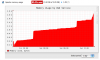
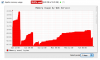
I've also attached a screenshot of the health monitor which keeps alarming.

I'm not sure where to start. Can anyone please help?
 

Attachments

  • healthmonitor.png
    healthmonitor.png
    43.4 KB · Views: 48
Last edited:
I probably should have mentioned that both are configured to run PHP as a module (rather than FastCGI/CGI), and both have relatively simple sites running Joomla and WordPress.
 
Apache memory use continuing to climb.

root 1483 0.0 0.8 432824 19956 ? Ss Feb04 0:00 /usr/sbin/httpd
apache 1497 0.0 0.2 217692 5556 ? S Feb04 0:00 /usr/sbin/httpd
apache 1504 0.0 7.7 607860 179400 ? S Feb04 0:17 /usr/sbin/httpd
apache 1505 0.0 6.7 589428 156564 ? S Feb04 0:16 /usr/sbin/httpd
apache 1506 0.0 5.9 567876 136904 ? S Feb04 0:16 /usr/sbin/httpd
apache 1507 0.0 6.9 592500 160708 ? S Feb04 0:16 /usr/sbin/httpd
apache 1510 0.0 7.0 587380 162104 ? S Feb04 0:17 /usr/sbin/httpd
apache 1511 0.0 7.6 608892 176360 ? S Feb04 0:18 /usr/sbin/httpd
apache 1513 0.0 7.2 596596 167568 ? S Feb04 0:19 /usr/sbin/httpd
apache 1514 0.0 7.0 596596 162516 ? S Feb04 0:18 /usr/sbin/httpd
apache 1517 0.0 6.4 582392 148920 ? S Feb04 0:16 /usr/sbin/httpd
apache 1566 0.0 6.6 588536 154060 ? S Feb04 0:17 /usr/sbin/httpd
apache 1568 0.0 6.7 588412 155204 ? S Feb04 0:16 /usr/sbin/httpd
apache 1620 0.0 6.7 589436 156064 ? S Feb04 0:16 /usr/sbin/httpd
apache 7928 0.0 5.0 563788 116276 ? S Feb04 0:08 /usr/sbin/httpd
apache 9728 0.0 3.6 532064 84968 ? S 00:08 0:05 /usr/sbin/httpd
apache 15808 0.0 1.3 440060 30112 ? S 11:13 0:00 /usr/sbin/httpd

Now pushing 7% per process.

Health monitor screenshot attached.
 

Attachments

  • healthmonitor.png
    healthmonitor.png
    42.1 KB · Views: 33
Each Apache process now pushing 8%/9% of system memory. Total Apache memory usage is now 82.4% of system memory, and still rising.

root 1483 0.0 0.8 432824 18636 ? Ss Feb04 0:00 /usr/sbin/httpd
apache 1497 0.0 0.1 217692 3964 ? S Feb04 0:00 /usr/sbin/httpd
apache 1504 0.0 7.7 635644 178756 ? S Feb04 0:21 /usr/sbin/httpd
apache 1505 0.0 7.8 612980 180408 ? S Feb04 0:20 /usr/sbin/httpd
apache 1506 0.0 7.0 597604 163240 ? S Feb04 0:20 /usr/sbin/httpd
apache 1507 0.0 8.1 635644 188148 ? S Feb04 0:21 /usr/sbin/httpd
apache 1510 0.0 8.1 623352 188264 ? S Feb04 0:22 /usr/sbin/httpd
apache 1511 0.0 8.3 627324 192392 ? S Feb04 0:22 /usr/sbin/httpd
apache 1513 0.0 8.3 628472 193884 ? S Feb04 0:24 /usr/sbin/httpd
apache 1514 0.0 8.3 625268 192580 ? S Feb04 0:23 /usr/sbin/httpd
apache 1517 0.0 7.7 612224 178832 ? S Feb04 0:20 /usr/sbin/httpd
apache 1566 0.0 9.1 644856 211084 ? S Feb04 0:23 /usr/sbin/httpd
apache 1568 0.0 7.1 598652 165832 ? S Feb04 0:20 /usr/sbin/httpd
apache 1620 0.0 8.3 624388 193144 ? S Feb04 0:22 /usr/sbin/httpd
apache 7928 0.0 6.1 587648 141164 ? S Feb04 0:12 /usr/sbin/httpd
apache 9728 0.0 5.2 567016 120984 ? S 00:08 0:10 /usr/sbin/httpd
apache 15808 0.0 4.1 544356 95612 ? S 11:13 0:04 /usr/sbin/httpd
apache 17106 0.0 1.1 436944 26580 ? S 14:47 0:00 /usr/sbin/httpd
 

Attachments

  • healthmonitor.png
    healthmonitor.png
    42 KB · Views: 25
Only the modules that come with Plesk 10.1.1. These are the LoadModule directives called from the /etc/httpd/conf/httpd.conf and /etc/httpd/conf.d/*.conf files.

LoadModule auth_basic_module modules/mod_auth_basic.so
LoadModule auth_digest_module modules/mod_auth_digest.so
LoadModule authn_file_module modules/mod_authn_file.so
LoadModule authn_alias_module modules/mod_authn_alias.so
LoadModule authn_anon_module modules/mod_authn_anon.so
LoadModule authn_dbm_module modules/mod_authn_dbm.so
LoadModule authn_default_module modules/mod_authn_default.so
LoadModule authz_host_module modules/mod_authz_host.so
LoadModule authz_user_module modules/mod_authz_user.so
LoadModule authz_owner_module modules/mod_authz_owner.so
LoadModule authz_groupfile_module modules/mod_authz_groupfile.so
LoadModule authz_dbm_module modules/mod_authz_dbm.so
LoadModule authz_default_module modules/mod_authz_default.so
LoadModule ldap_module modules/mod_ldap.so
LoadModule authnz_ldap_module modules/mod_authnz_ldap.so
LoadModule include_module modules/mod_include.so
LoadModule log_config_module modules/mod_log_config.so
LoadModule logio_module modules/mod_logio.so
LoadModule env_module modules/mod_env.so
LoadModule ext_filter_module modules/mod_ext_filter.so
LoadModule mime_magic_module modules/mod_mime_magic.so
LoadModule expires_module modules/mod_expires.so
LoadModule deflate_module modules/mod_deflate.so
LoadModule headers_module modules/mod_headers.so
LoadModule usertrack_module modules/mod_usertrack.so
LoadModule setenvif_module modules/mod_setenvif.so
LoadModule mime_module modules/mod_mime.so
LoadModule dav_module modules/mod_dav.so
LoadModule status_module modules/mod_status.so
LoadModule autoindex_module modules/mod_autoindex.so
LoadModule info_module modules/mod_info.so
LoadModule dav_fs_module modules/mod_dav_fs.so
LoadModule vhost_alias_module modules/mod_vhost_alias.so
LoadModule negotiation_module modules/mod_negotiation.so
LoadModule dir_module modules/mod_dir.so
LoadModule actions_module modules/mod_actions.so
LoadModule speling_module modules/mod_speling.so
LoadModule userdir_module modules/mod_userdir.so
LoadModule alias_module modules/mod_alias.so
LoadModule rewrite_module modules/mod_rewrite.so
LoadModule proxy_module modules/mod_proxy.so
LoadModule proxy_balancer_module modules/mod_proxy_balancer.so
LoadModule proxy_ftp_module modules/mod_proxy_ftp.so
LoadModule proxy_http_module modules/mod_proxy_http.so
LoadModule proxy_connect_module modules/mod_proxy_connect.so
LoadModule cache_module modules/mod_cache.so
LoadModule suexec_module modules/mod_suexec.so
LoadModule disk_cache_module modules/mod_disk_cache.so
LoadModule file_cache_module modules/mod_file_cache.so
LoadModule mem_cache_module modules/mod_mem_cache.so
LoadModule cgi_module modules/mod_cgi.so
LoadModule version_module modules/mod_version.so
LoadModule ssl_module /usr/lib64/httpd/modules/mod_ssl.so
LoadModule bw_module /usr/lib64/httpd/modules/mod_bw.so
LoadModule fcgid_module modules/mod_fcgid.so
LoadModule perl_module modules/mod_perl.so
LoadModule php5_module modules/libphp5.so
LoadModule php5_module modules/libphp5-zts.so
LoadModule proxy_ajp_module modules/mod_proxy_ajp.so
LoadModule python_module modules/mod_python.so
 
Have same problem:

apache 1415 0.3 3.5 390188 56160 ? S Feb07 2:25 /usr/sbin/httpd
apache 1725 0.3 2.3 370956 36616 ? S Feb07 2:35 /usr/sbin/httpd
apache 1727 0.3 2.3 371056 36820 ? S Feb07 2:43 /usr/sbin/httpd
apache 1728 0.3 2.3 371592 37224 ? S Feb07 2:41 /usr/sbin/httpd
apache 1729 0.3 2.3 370936 36652 ? S Feb07 2:42 /usr/sbin/httpd
apache 1730 0.3 2.3 371568 37172 ? S Feb07 2:17 /usr/sbin/httpd
apache 1911 0.3 2.3 371252 36936 ? S Feb07 2:27 /usr/sbin/httpd
apache 1916 0.3 2.3 371980 37672 ? S Feb07 2:25 /usr/sbin/httpd
apache 2492 0.3 3.5 390092 56076 ? S Feb07 2:10 /usr/sbin/httpd
apache 6080 0.2 3.5 389964 55924 ? S Feb07 1:28 /usr/sbin/httpd
root 14591 0.0 0.0 61172 780 pts/0 S+ 08:44 0:00 grep httpd
root 27086 0.0 1.0 291272 16016 ? Ss Feb07 0:01 /usr/sbin/httpd
apache 27088 0.0 0.3 229472 5448 ? S Feb07 0:00 /usr/sbin/httpd
apache 27089 0.4 3.5 390324 56404 ? S Feb07 3:46 /usr/sbin/httpd
apache 27091 0.4 3.6 390744 57004 ? S Feb07 3:40 /usr/sbin/httpd
apache 27092 0.4 2.4 372424 38176 ? S Feb07 3:48 /usr/sbin/httpd
apache 27093 0.4 3.5 390276 56324 ? S Feb07 3:30 /usr/sbin/httpd
apache 27094 0.4 2.4 372428 38196 ? S Feb07 3:42 /usr/sbin/httpd
apache 27095 0.4 3.5 390304 56392 ? S Feb07 3:28 /usr/sbin/httpd
apache 27238 0.4 3.6 390732 56904 ? S Feb07 3:41 /usr/sbin/httpd
apache 27384 0.4 2.3 371196 36968 ? S Feb07 3:23 /usr/sbin/httpd
apache 28335 0.4 2.3 371816 37384 ? S Feb07 3:37 /usr/sbin/httpd
apache 28469 0.3 2.4 372692 38488 ? S Feb07 3:10 /usr/sbin/httpd

And CPU goes 100% with sw-collectd and need to stop it

I'm only hosting 2 webs!

KeepAlive is set to Off and Persistent Connections with Mysql too.
 
Over the weekend I have enable the Watchdog module service monitor (which was installed but not enabled previously), and that has changed things slightly.

As you can see from the attached screenshot, Apache total memory builds more slowly, gets to just under 50% and then the service restarts. Previously it would get to 100% and bring the server down.

Again—anyone from Parallels care to help? This is a real issue, measurable and reproducible.
 

Attachments

  • healthmonitor.png
    healthmonitor.png
    42.4 KB · Views: 41
I tell a lie. Total Apache memory use is up to 70% again and climbing. Server beginning to slow down. Swap usage is beginning to climb as the server is running out of free memory.

Help!
 
I think its normal... for months maybe longer mine use 14% memory ea

This has not affected the servers performance at all.
 
It's not normal. The server crashes when Apache memory use reaches 100% of system memory. If that's normal I'm a banana. :)
 
Mem:
2070552k total
2017400k used
53152k free

Thats what I run almost 100% of the time.
When you "top" are there any other processes runing that are consuming mem?

Look at time too so you can see how long they have been running.
 
Thanks for the comments littlefrog, but you are wrong. It's more than just "high" memory usage. The server is crashing.

I just had 45 minutes of outage where the server ran out of memory and ground to a halt due to Apache.

The attached screen grabs show that total Apache memory use rose to 2.2GB, and then died. If you look at the swap usage graph it shows that swap usage rose dramatically as the server ran out of memory.

I repeat—I had no issues until I upgraded to Plesk 10.1.1. I have a Plesk 9 server that is running like a dream.

Can anybody help?? I'm just some help to troubleshoot this.
 

Attachments

  • apache_memory.png
    apache_memory.png
    41.5 KB · Views: 33
  • swap_usage.png
    swap_usage.png
    39.2 KB · Views: 29
hey don't get me wrong... i am just trying to help troubleshoot.

While my server is running fine i upgraded to pp10.1.1 and my entire control pannel is hosed.

Cant add domains, email accounts, domain aliases or anything.
Put in a trouble ticket i had to pay for and it has been over 24 hrs and i still havn't even gotten a response...

So trust me I AM NOT HAPPY

however freaking out isn't going to help me resolve my problems so i sit patiently and wait.

during the times of peak have you reviewed weblogs to see whats going on?
Maybe someone is trying to hack in and the new pp is vulnerable to attacks in a way that pp9 wasn't.

Personally i don't allow clients to use Joomla because of exploits.
 
Can you suggest which log to start with, things to look for, and I'll feed back what I find?

I have looked in the logs, but to my level of knowledge I can't see anything that would suggest this kind of issue.
 
first start with
/var/log/secure
/var/log/messages
/var/log/httpd/suexec_log
/var/log/httpd/error_log
/var/log/httpd/suexec_log
 
In /var/log/httpd/access_log I am seeing a bunch of these

::1 - - [10/Feb/2011:21:04:46 +0000] "OPTIONS * HTTP/1.0" 200 - "-" "Apache (internal dummy connection)"

and these

X.X.X.X - - [06/Feb/2011:05:42:17 +0000] "GET / HTTP/1.1" 200 6735 "-" "-"

I have replaced the server IP with X.X.X.X in the second example.
 
I got a simelar issue, not so high, but still higher than i would like it to be:


[root@xxxxxxxx ~]# ps aux | grep httpd
root 4649 0.0 2.4 317932 25452 ? Ss 15:05 0:00 /usr/sbin/httpd
apache 4666 0.0 1.2 226204 13080 ? S 15:05 0:00 /usr/sbin/httpd
apache 4881 0.0 3.6 390248 38168 ? S 15:05 0:01 /usr/sbin/httpd
apache 4882 0.0 3.7 392560 39804 ? S 15:05 0:01 /usr/sbin/httpd
apache 4883 0.0 2.1 321448 22804 ? S 15:05 0:00 /usr/sbin/httpd
apache 4884 0.0 3.6 390264 38144 ? S 15:05 0:01 /usr/sbin/httpd
apache 4944 0.0 3.6 390484 38528 ? S 15:05 0:01 /usr/sbin/httpd
apache 4952 0.0 2.3 378004 24940 ? S 15:05 0:00 /usr/sbin/httpd
apache 4960 0.0 3.6 390276 37896 ? S 15:05 0:01 /usr/sbin/httpd
apache 4961 0.0 3.7 391552 38800 ? S 15:05 0:00 /usr/sbin/httpd
apache 4989 0.0 2.8 382476 29936 ? S 15:05 0:00 /usr/sbin/httpd
apache 5025 0.0 3.7 391512 39316 ? S 15:05 0:01 /usr/sbin/httpd
apache 5027 0.0 2.6 381408 28252 ? S 15:05 0:00 /usr/sbin/httpd
apache 5042 0.0 3.7 390920 39048 ? S 15:06 0:01 /usr/sbin/httpd
apache 5043 0.0 3.6 389860 37924 ? S 15:06 0:01 /usr/sbin/httpd
apache 5044 0.0 2.2 321472 23152 ? S 15:06 0:00 /usr/sbin/httpd
apache 5106 0.0 2.6 381212 28064 ? S 15:06 0:00 /usr/sbin/httpd
root 26170 0.0 0.0 61148 768 pts/0 R+ 16:22 0:00 grep httpd
 
Back
Top