• If you are still using CentOS 7.9, it's time to convert to Alma 8 with the free centos2alma tool by Plesk or Plesk Migrator. Please let us know your experiences or concerns in this thread:
    CentOS2Alma discussion

Constant "Alarm level changed" emails

dotchd

New Pleskian
This problem has been reported before Plesk Panel 11. What's the current solution for this problem? I've got this problem since I upgraded to Plesk Panel 11.09.

I'm getting spammed with emails like:

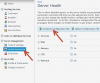
Server health parameter "Services > Apache memory usage" changed its status from "green" to "yellow".


Anyone?
 
Last edited:
Solved; edited the custom-health-config, which can be downloaded and uploaded from the health monitor in Plesk. Strangly, there are 17 blank lines in the default config, so scroll down to see all the values.
 
Have the same message and emails. Can anyone give some good values for default config?

Server health parameter "Services > Apache CPU usage" changed its status from "yellow" to "red".

top - 13:22:54 up 20 days, 2:20, 1 user, load average: 0.37, 0.25, 0.21
Tasks: 320 total, 1 running, 319 sleeping, 0 stopped, 0 zombie
Cpu(s): 1.0%us, 0.5%sy, 0.6%ni, 97.3%id, 0.5%wa, 0.0%hi, 0.0%si, 0.0%st
Mem: 32814452k total, 29989144k used, 2825308k free, 593684k buffers
Swap: 2097144k total, 1572k used, 2095572k free, 22199196k cached

I´ve loaded the custom-health-config.xml and have this in cpu:

<Cpu>
<TotalUsage>


<alarm level="red" threshold="95" type="percent"/>
<alarm level="yellow" threshold="90" type="percent"/>
</TotalUsage>
<Queue period="shortterm"/>
<Processes/>
</Cpu>

Is there something missing?
 
Last edited:
Solved; edited the custom-health-config, which can be downloaded and uploaded from the health monitor in Plesk. Strangly, there are 17 blank lines in the default config, so scroll down to see all the values.

I have the same problem but I can't find blank lines. Could you please xplain exactly what you changed? thanks.
 
Constant alarm level changed emails

Hello

I am getting exactly the same problem as described here when I upgraded to 11.09 except I can't seem to find the health monitor option anywhere on my panel. My tools and settings under server tab looks like the attachment (which is where I would expect it to be).

Is it hidden somewhere or am I just blind?

Many thanks

Adrian
 

Attachments

  • Tools & Settings - Parallels Plesk Panel 11.0.9.png
    Tools & Settings - Parallels Plesk Panel 11.0.9.png
    134.1 KB · Views: 171
Option you're looking for is not in "Tools & Settings". Check attached image below:
 

Attachments

  • health_monitoring.png
    health_monitoring.png
    63.1 KB · Views: 278
Hello

Thanks for your reply. I don't have that, I only have tools & settings and extensions tabs. There is no health monitor tab anywhere to click on. I can see health monitor under components running but there are no options to do anything with it, it's just a list.

Many thanks

Adrian
 
To assist any others, I think I have fixed the problem despite not having the health monitor option available on the web admin.

This page (http://kb.parallels.com/en/111283) contains the location of all configuration files and the health monitor files are located at:

/usr/local/psa/admin/conf/health-config.xml
/usr/local/psa/var/custom-health-config.xml
/etc/sw-collectd/collectd.conf

I edited just /usr/local/psa/var/custom-health-config.xml and altered the bottom parts which were set to 20 and 25% thresholds to 95 and 90% thresholds (see below). It's not been a full day so far but since making the changes I haven't had a single email whereas before the change I would have had around 10 or so by now.

<TotalUsage>


<alarm level="red" threshold="95" type="percent"/>
<alarm level="yellow" threshold="90" type="percent"/>
</TotalUsage>
<Queue period="longterm"/>
<Processes/>
</Cpu>
<Network>
<Bandwidth>
<device name="lo" monitor="false"/>
<device name="eth0" monitor="true"/>
</Bandwidth>
</Network>
<Services>
<CpuTime>
<service name="Web" monitor="true">
<alarm level="red" threshold="95" type="percent"/>
<alarm level="yellow" threshold="90" type="percent"/>
</service>
<service name="Mail" monitor="true">
<alarm level="red" threshold="95" type="percent"/>
<alarm level="yellow" threshold="90" type="percent"/>
</service>
<service name="MySql" monitor="true">
<alarm level="red" threshold="95" type="percent"/>
<alarm level="yellow" threshold="90" type="percent"/>
</service>
<service name="Panel" monitor="true">
<alarm level="red" threshold="95" type="percent"/>
<alarm level="yellow" threshold="90" type="percent"/>
</service>
</CpuTime>
<MemoryUsage>
<service name="Web" monitor="true">
<alarm level="red" threshold="95" type="percent"/>
<alarm level="yellow" threshold="90" type="percent"/>
</service>
<service name="Mail" monitor="true">
<alarm level="red" threshold="95" type="percent"/>
<alarm level="yellow" threshold="90" type="percent"/>
</service>
<service name="MySql" monitor="true">
<alarm level="red" threshold="95" type="percent"/>
<alarm level="yellow" threshold="90" type="percent"/>
</service>
<service name="Panel" monitor="true">
<alarm level="red" threshold="95" type="percent"/>
<alarm level="yellow" threshold="90" type="percent"/>
</service>
</MemoryUsage>
</Services>
</configdata>
 
But if you do so you are raising too much alarm levels. Maybe 25% of total memory i'ts not so much but 95% you'll get the alarms when your apache is already down
 
It depends on your hardware and your apache configuration ( how many process are running, the weight of each process...). You have to tune your apache so theoretically know in advance the maximum use of memory it would have and from that set the alarm levels.
 
Anything above 50% is dangerous ...Usually when server load climbs that far the remaining percentage is consumed in minutes if not seconds ...
 
I have same Problem with one Root Server @ Debian 6.04 but since 11.0.9 #10
Everyday 2-6 Mails green to yellow ... yellow to green

Should i change Parameter or wait for Parallels :D or i have attacks on Server

Server health parameter "Services > Apache CPU usage" changed its status from "green" to "yellow".

top - 03:40:40 up 11 days, 1:47, 1 user, load average: 0.69, 0.60, 0.46
Tasks: 173 total, 1 running, 172 sleeping, 0 stopped, 0 zombie
Cpu(s): 1.3%us, 0.2%sy, 0.0%ni, 97.5%id, 1.0%wa, 0.0%hi, 0.0%si, 0.0%st
Mem: 16417772k total, 9804500k used, 6613272k free, 1430000k buffers
Swap: 7825392k total, 0k used, 7825392k free, 6809152k cached

PID USER PR NI VIRT RES SHR S %CPU %MEM TIME+ COMMAND
5692 www-data 20 0 318m 55m 5072 S 34 0.3 0:29.94 apache2
1 root 20 0 8356 812 680 S 0 0.0 0:04.58 init
 
Cpu Core Problem

I have a Processor which has 12 core in that and Server Health monitor generate alerts based on only 1 core of the processor. How to resolve that issue?
 
This is really annoying, I have exactly the xame Problem! I have 12 Cores and the Alarm Levels are BADLY configured, after one Core gets to 100, the other Cores jump in, but then Plesk is already generating a warning mail. THIS IS ANNOYING, I get them 20+ per day!!
This never happened bevore on Plesk 10.
 
Back
Top