• If you are still using CentOS 7.9, it's time to convert to Alma 8 with the free centos2alma tool by Plesk or Plesk Migrator. Please let us know your experiences or concerns in this thread:
    CentOS2Alma discussion

Issue CPU usage on dedicated server

netart.gr

New Pleskian
Server operating system version
CentOS 64-bit
Plesk version and microupdate number
12
Hello there.
I have got about 100 websites in a dedicated server and every 7 days I restart the server because the checkout page and "order complete" proccess in woocommerce shops becomes too slow! (about 30-60 secs instead of 5 to 10 secs).
After restarting the server, the problem is solved and I'm receiving a message from Plesk " CPU total usage is back to normal".

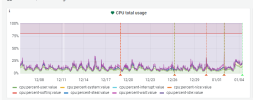
But I'dont get it. In this stat the cpu usage in the last 30 days was about 25%. So 75% was free!
1672820708506.png


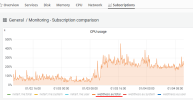
But in this stat one subscription uses 100% to 300% of CPU .
1672820834588.png

Do I a have a CPU issue or not?
Could you let me know if there is a way to test it?


Server Specs:
Intel® Core™ i9-9900K (128GB)
CentOS 64-bit
Plesk 12 - Web Host
 
Hi,

Seems we use different units (differently counted percentages) on these graphs and it definitely could confuse. I will confirm that hypothesis with dev.team.

Intel® Core™ i9-9900K (128GB)
If case of "CPU usage" for per subscription graphs:
  • Intel® Core™ i9-9900K has 8 cores (16 threads => some OS detect threads as vCPU). On the graph, each vCPU counts as 100%, that means subscriptions can utilize up to 800% on your server. So, it means different graphs shows quite close numbers, ~25% (200% of 800%) for the CPU unit.

Plesk 12 - Web Host
Based on the screenshot, I sure it is Plesk Obsidian (18.0.x) :)


I do not know details about how the woocommerce checkout works, but for me, it seems the speed depends on something different than CPU because I can't say the server is under heavy load.
 
Hello AYamshanov,
thank you for the detailed answer. So, it is not a cpu resource issue!
Yep, I didn't noticed that my Plesk's correct version is 18! :)

Unfortunately the problem still exists! Every seven days I have to reboot the server in order to run normally the proccess of woocommerce checkout.

Before reboot checkout process lasts about 30 secs. *I mean the time after I'm pressing the "complete order" button...
After reboot it lasts about 5 secs!

Is there a place to check if there is a proccess that loads the system? Something like a cache proccess that it is accumulated by time?
 
@netart.gr Do you have root access through SSH to the Linux console? For example using the free SSH extension?

In that case it could help to get a list of the running PHP-FPM processes, if some of them are long-running. That would be
# ps aux | grep php-fpm | grep -v master
in its simplest form. Are there processes that have started more than a few minutes ago? Do they create cpu load? When you reboot the server, all these processes are cleared, so after reboot things run smoothly again.

You can also check what query cache is set in your database configuration. That's a bit more tricky. You can start looking for anything that starts with "query_cache" in /etc/my.cnf or any /etc/my.cnf.d/* files. Also look out for "innodb_buffer_pool_size". The problem with these is that you should think, the larger the better. But that is not the case, because when a cache or buffer grows to large, it takes more time to search the cache for a cached query than it takes to execute the query directly. This can slow things down considerably. After a reboot, query caches, buffers etc. are recreated, which will have a positive effect (if they were "too large" before).

Finally, it is frequently observed that bad bots are hitting websites. You can see that in your /logs/access_ssl_log. Once they start crawling, they rarely stop. But they do stop when they are blocked temporarily, e.g. when you reboot your server. So that can also be a reason why your server appears faster after reboot, but slow after it has been operating a while.
 
Dear Mr Peter Debik,
thanks a lot for the detailed answer.

1. I have tried # ps aux | grep php-fpm | grep -v master but all proccesses listed have started a couple minutes ago..

2. I don't know how to search inside /etc/my.cnf

3. I have opend /logs/access_ssl_log and there are a lot of bots reffered. So what should I do? How to block all bots except from useful ones (google bot, I suppose, Microsoft bot etc)


*A final fact that I'm almost sure it exists: Slowing speed of my server begins in a specific day every week (although stats inform me of plenty of free ram, cpu etc). It is after Saturday and before Sunday. So every Sunday all websites of my server are slow! If I schedule a system restarting at early at Sunday morning (let's say 5am) then probably the problem will be solved (in a rough way).

I'm attaching you my scheduled actions list. Could be one of these actions the problem? Is there a specialist I could pay to examine my problem?
 

Attachments

  • compressed.pdf
    175.7 KB · Views: 0
As you said it's Woocommerce, it must be a Wordpress website. In that case there a simple security checkbox "Enable bot protection" in WP Toolkit > Security > Fix vulnerabilities > Tab "Security Measures".

Another option is the typical .htaccess approach. In that you can simply add these lines to the beginning of the existing .htaccess file in your document root directory of the website (Wordpress will already have such a file, regardless of what it contains, insert these lines to the beginning of it):
Code:
RewriteEngine On
RewriteBase /
RewriteCond %{HTTP_USER_AGENT} (PetalBot|UptimeRobot|seocompany|LieBaoFast|SEOkicks|Uptimebot|Cliqzbot|ssearch_bot|domaincrawler|AhrefsBot|spot|DigExt|Sogou|MegaIndex.ru|majestic12|80legs|SISTRIX|HTTrack|Semrush|MJ12|MJ12bot|MJ12Bot|Ezooms|CCBot|TalkTalk|Ahrefs|BLEXBot) [NC]
RewriteRule .* - [F]
This is not the best solution. It would be better to apply such rules to Nginx (then in Nginx syntax), but it is easier to do it by the .htaccess file to mitigate your issue for the time begin.
 
Dear Mr Debik,
Thank you for the quick answer. I have added this code to a demo website but nothing changed.
Something happens to the server that creates malfunctions.

I had a scheduled backup task to a google drive account every Sunday at 3am. It matches with the fact that every Sunday (and so on) server behaves strangely.
Slow browsing, very slow checkout completion (30 secs!!!) So I deactivated this scheduled task hoping this will fix the problem (I have also acronis backup activated but I wanted a whole backup in an another location).


I'm attaching a video showing the problem. As you can see, it is a really basic woocommerce website. Page loading isn't too slow (2-3 secs) but order complete proccess is very slow (30 secs!).

After restarting (I will restart server before Monday morning cause customers will be complaining) the page loading is being reduced to 1 second. It is normal cause it is a very basic woocommerce shop. Also, order completion (after pressing the complete order button) lasts about 5 seconds!
 

Attachments

  • problem-explained.zip
    1 MB · Views: 2
Dear Mr Debik,
Thank you for the quick answer. I have added this code to a demo website but nothing changed.
Something happens to the server that creates malfunctions.

I had a scheduled backup task to a google drive account every Sunday at 3am. It matches with the fact that every Sunday (and so on) server behaves strangely.
Slow browsing, very slow checkout completion (30 secs!!!) So I deactivated this scheduled task hoping this will fix the problem (I have also acronis backup activated but I wanted a whole backup in an another location).


I'm attaching a video showing the problem. As you can see, it is a really basic woocommerce website. Page loading isn't too slow (2-3 secs) but order complete proccess is very slow (30 secs!).

After restarting (I will restart server before Monday morning cause customers will be complaining) the page loading is being reduced to 1 second. It is normal cause it is a very basic woocommerce shop. Also, order completion (after pressing the complete order button) lasts about 5 seconds!

@netart.gr

First of all, the code should not be added to a demo website in order to notice the effect of the code : add it to the production site.

However, as a fan of Nginx, I would recommend to use Nginx as a proxy in order to keep some bots and bad traffic away - that is always better than using the .htaccess file that operates on the Apache web server level, for many reasons and I will mention two of them :

1 - Apache is resource heavy : it uses a lot of memory and other resources, whereas Nginx is fast and not resource heavy at all

2 - Nginx as a proxy is "in front" of Apache : any bad traffic is best to be stopped before it reaches Apache


Second, when reading your posts I already assumed that it might be related to scheduled backups........ and you confirm that to some extent in your last post.

I am not sure whether you make a server-wide backup or a subscription/domain based backup.

I am assuming that you have a server-wide backup scheduled ......... which type of backup can take a lot of resources and a lot of time.

I am not certain, but I can also assume to some degree that you have an incremental backup.


In essence, you should first try to get your backups well structured by

3 - using full backups : do not use incremental backups, this will use a lot of disk or storage space and also a lot of resources

4 - using subscription based backups : make subscription based backups on a regular basis and 1 server-wide backup per month - that is really enough!

5 - using local storage : Google Drive can be very slow and very unsafe (read: disconnection will cause your backup to be stopped or even to be broken)

6 - using local storage for high-frequent backups

7 - using remote storage for low-frequent backups, if and only if those backups are relatively small in size

8 - use FTPS (not SFTP) to transport local storage files to remote storage : fast and safe, since the connection will almost never time-out!


I am pretty sure that you will not have and/or will have considerably less performance issues when executing steps 3 to 8.

If you still encounter issues, then it is time to have a look at the traffic and/or at the IPs banned by Fail2Ban ...... but that is another story.


I hope that the above helps ...... and awaiting your news!

Kind regards....
 
Back
Top