• Plesk Uservoice will be deprecated by October. Moving forward, all product feature requests and improvement suggestions will be managed through our new platform Plesk Productboard.
    To continue sharing your ideas and feedback, please visit features.plesk.com

Question Detect what caused Apache and CPU to spike for an hour

SquanchIt

New Pleskian
Hey guys,

So the monitoring tool is reporting that the server's CPU, Apache, Nginx, as well as disk read and write spiked for about an hour an a half.

What's a good way to detect which site was responsible for the heavy load?

Thanks!

Edit: I checked the bandwidth on all the domains and daily average statistics, nothing unusual there.
 
Last edited:
Hi SquanchIt,

What's a good way to detect which site was responsible for the heavy load?

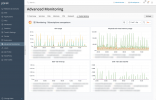
Since Advanced Monitoring 1.4.0, it is possible to show CPU/memory usage per subscription. This feature is based on metrics that are collected by Cgroups Manager. It does not help to find out what is happened in the past but could help with possible future questions about websites' usage.


Advanced Monitoring.png
 
Hi SquanchIt,


Since Advanced Monitoring 1.4.0, it is possible to show CPU/memory usage per subscription. This feature is based on metrics that are collected by Cgroups Manager. It does not help to find out what is happened in the past but could help with possible future questions about websites' usage.


View attachment 18394
Hi AYamshanov,

Thank you for your response.

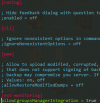
While your solution doesn't help me with the issue I am having since those spikes tend to happen while I am asleep. This is still a cool feature that I want to enable on my server. I have less than 10 subscriptions on my server, so I am surprised that it's not already enabled, so I tried enabling it manually by adding the following lines to panel.ini:

1613872268555.png

but that didn't seem to work for some reason. Do I need to restart the server?

Thanks!
 
Back
Top