• Hi, Pleskians! We are running a UX testing of our upcoming product intended for server management and monitoring.
    We would like to invite you to have a call with us and have some fun checking our prototype. The agenda is pretty simple - we bring new design and some scenarios that you need to walk through and succeed. We will be watching and taking insights for further development of the design.
    If you would like to participate, please use this link to book a meeting. We will sent the link to the clickable prototype at the meeting.
  • Our UX team believes in the in the power of direct feedback and would like to invite you to participate in interviews, tests, and surveys.
    To stay in the loop and never miss an opportunity to share your thoughts, please subscribe to our UX research program. If you were previously part of the Plesk UX research program, please re-subscribe to continue receiving our invitations.
  • The Horde webmail has been deprecated. Its complete removal is scheduled for April 2025. For details and recommended actions, see the Feature and Deprecation Plan.

Issue High CPU usage and poor performance (MYSQL)

aromero

New Pleskian
Server operating system version
Ubuntu 20.04.2 LTS
Plesk version and microupdate number
18.0.58 #2
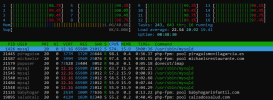
Hello, we're having some problems with the performance of the server. Right now, it looks like the CPU usage is almost at 100% all the time, and the process that is taking most of the usage is mysql:
1707734420572.png
As of today, we haven't figured out what to do in this case. We can't give more resources to the server since is already at it's maximum. Of course, this translates in poor performance on mysql databases aswell.

I've recently added this on the config file of mysql, but It didn't do much.
1707734371418.png
We need some help with this.
 

Attachments

  • 1707734179417.png
    1707734179417.png
    58.4 KB · Views: 8
  • 1707734417166.png
    1707734417166.png
    58.6 KB · Views: 9
What is the domain log, the mysql.log? We had to disable the mysql.log because it would grow way too fast.
 
e.G. Backend Plesk - Domains - Logs: you see time, ip, executed file - status of execution (200, 404..) and there you can look for strage execution with sql commands like create, select... and u can judge is it normal or not (likley php files are ued to exploit with adding "?BAD-COMMAND")
Or look at the different jounals at cli what Peter mentioned
 
One thing I've noticed is that after I enabled the mysql.log momentarily it increased 5GB in a matter of seconds, and checking the log the server is doing massive queries with thousands of IDs (Mostly PrestaShop queries). I'm inclined to think we (or some client) is getting attacked via PrestaShop queries.1707812369995.png
(Multiply that by infinite, basically)
 
I'm inclined to think we (or some client) is getting attacked via PrestaShop queries.
Yes, that seems to be just right. You'll probably also see something like frequently repeated requests in the access_ssl_log of the site with changing parameters (...?<parameter>=...).
Quick fix: plesk bin ip_ban --ban <offending ip address here>,recidive

Or, if the attacks come from different sources, finde the top requestors:
cat access_ssl_log | awk '{print $1}' | sort -n | uniq -c | sort -n
Then ban them (but watchout that you do not ban your own server IP).
 
Might also a search engine crawler going through all your listing options. In that case you should probably not ban them if you still want to be found, but instead adjust the robots.txt and declare links to search pages as nofollow.
 
Back
Top