• Debian 11 is approaching its end-of-life (vendor EOL date - August 31, 2026). Plesk Obsidian 18.0.80 will be the last release to support it.
    If you are running Plesk Obsidian on Debian 11, we recommend you upgrade those servers to Debian 12 using our dist-upgrade tool.
  • We plan to deprecate and remove the support for XML RPC protocol versions earlier than 1.6.9.1 in Plesk Obsidian 18.0.82. We strongly recommend that you update all existing integrations using earlier versions of the XML RPC protocol to comply with the version 1.6.9.1 specification.

Issue High CPU usage. How to read the Monitoring table

goodomen

New Pleskian
Server operating system version
Ubuntu 20.04.6 LTS
Plesk version and microupdate number
18.0.61 Update #5
Hello my server has High CPU usage.
I see in the Monitoring this.
How do I read it?
How can I know which website or process is taking all the CPU?
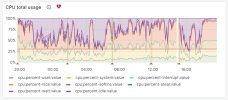
How to read this CPU total usage.JPG
How to read the Monitoring table
 
Based on the graph, I think we can only say something is utilizing the CPU. If you change the timeframe to a week or a month, it could be possible to understand when exactly it was started. Based on this graph, it is hard to say what exactly the reason is here. At least, the graph says that need to look a little bit deeper to understand what generates the usage: is it legitimate usage and maybe need to upgrade the server hardware? is some website poorly written? is there some virus generating usage?

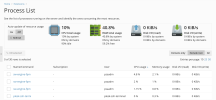
  • With the Monitoring extension, you can check all rest tabs to find more clues on what could generate CPU usage (the "Services" tab).
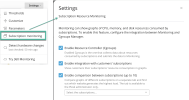
  • Also with the Monitoring extension (the "Settings" button on the Monitoring extension page), if your system supports cgroups feature, it is possible to start monitoring subscriptions usage. If the issue with a subscription, it could help to find out which one,
1719508658529.png

1719508912095.png
 
Back
Top