• Please be aware: Kaspersky Anti-Virus has been deprecated
    With the upgrade to Plesk Obsidian 18.0.64, "Kaspersky Anti-Virus for Servers" will be automatically removed from the servers it is installed on. We recommend that you migrate to Sophos Anti-Virus for Servers.
  • The Horde webmail has been deprecated. Its complete removal is scheduled for April 2025. For details and recommended actions, see the Feature and Deprecation Plan.
  • We’re working on enhancing the Monitoring feature in Plesk, and we could really use your expertise! If you’re open to sharing your experiences with server and website monitoring or providing feedback, we’d love to have a one-hour online meeting with you.

Question High CPU Usage?

weldy

New Pleskian
Server operating system version
Ubuntu 22.04.3 LTS
Plesk version and microupdate number
18.0.58
I have 2 websites (1 staging, 1 live) running Wordpress and Woocommerce.

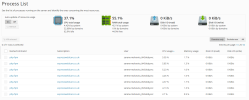
1. Using Process List, I can see that there is never any disk read or write activity. Is something not configured correctly?
2. Each php-fpm process takes between 3 - 10% CPU usage. Is this normal? If not, how can I find the root cause so that I can lower the usage?

1705338754320.png
 
I am having the exact same issue. I have 5 Wordpress/woocommerce sites on my AWS account and you can see, the use shot up. When I view the process list like the user above, the woocommerce sites will have multiple php-fpm processes running 4% to 10% CPU. I had to increase my server instance so that I wouldn't be completely dead in the water. It is frustrating to see there is no answer since Monday as much as I pay for Plesk each month.
 
Why do you believe that Plesk has anything to do with deficiencies of your website? Plesk is a web server control panel that makes it easier to control services and settings of a server. It is not an optimization software for Woocommerce issues.

You need to look into your access_ssl_log what incoming requests are causing the cpu load. Normally these are bad bots that can easily be blocked by a properly configured and active Fail2Ban rule. You could also check your error_log whether you find something that could be causing unnecessary traffic or processing in your website.
Are you serious? Perhaps you aren't aware of issues like this: https://support.plesk.com/hc/en-us/...idden-error-after-a-WooCommerce-plugin-update

You may operate under the impression that nothing Plesk does could ever be wrong, but when a performance comes up suddenly at the same time of a Plesk update and you have not made changes to your woocommerce sites which were working fine prior to the Plesk update, then those of us who are not plesk-biased, conclude something in the Plesk update is causing a problem as has clearly happened in the past. Furthermore, when you talk to other people using woocommerce sites NOT on plesk and they do not have any issues, that further makes Plesk a suspect. Perhaps this is just coincidence, we don't know yet as there hasn't been a solution. However, to dismiss this out of hand is quite disingenuous.
 
Thank you, I am well aware of the Comodo ruleset issue, but it has nothing to do with the case described in this thread.

Without analyzing the log files I'd rather say it is daring to blame Plesk for causing a slow website or high cpu load. What did you do to find out the cause so far?
 
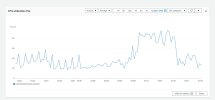
I appreciate your response. I guess, I don't mean to blame Plesk so much as to include it in the trouble-shooting. If you notice on the CPU % utilization, the server was running along at roughly 30% utilization until Jan. 9. Then it suddenly maxed out and stayed there until I switched to a more powerful server configuration, where you can see it dropped down again. Since this isn't a gradual increase (the CPU% has been relatively steady back to June), I was trying to locate whatever change must have occurred at the time of the increase. I personally am limited on my server abilities and have had a couple AWS IQ "experts" look into it. This is where we are at this point in the trouble shooting:

- PHP configuration was updated Jan 9, likely related to Plesk Obsidian 18.0.58 release
- CPU usage has been higher since this point
- Wordpress sites in particular seem to be using much higher CPU since this date

That's when I did a search and found this thread where the user above described the exact same problem. I was pretty frustrated to see no response to that post as the answer to his problem, was the best hope to fix my problem. I admit that I could have posted in a friendlier way here. My frustration is getting the better of me as this has consumed my week and prevented me from doing much needed work. I can't really move ahead without fixing this.
 

Attachments

  • plesk_forum.jpg
    plesk_forum.jpg
    86.2 KB · Views: 8
Here is a screenshot of my process list. Unlike the above user, I have multiple sites and a mix. There are non-wordpress PHP sites which are functioning perfectly. There are some wordpress sites without woocommerce that use more CPU, but it's about what you expect from WP. then there are the woocommerce sites, and these these are using a ton of processor as you can see. There is also a process awstats.pl which runs for a few hours and uses 30% or more CPU for that time. I haven't gone further into that issue as I think it is secondary to whatever is happening.
 

Attachments

  • cpu_usage_plesk_forum.jpg
    cpu_usage_plesk_forum.jpg
    166.9 KB · Views: 14
What you could do is to run
MYSQL_PWD=`cat /etc/psa/.psa.shadow` watch "ps aux | sort -nrk 3,3 | head -n 20 && echo "\ " && mysqladmin proc status -u admin"
from the console to see a "live" view of the processes that are causing the highest load and an updated process list of the database. This will very likely reveal which website(s) are causing the issue.

From there you'd descend into /var/www/vhosts/<subscription name>/logs/[website name] and look into the access_ssl_log file what requests are incoming to that website. If you find lines like
Code:
123.123.123.123 - - [16/Jul/2023:20:26:11 +0200] "GET / HTTP/1.1" 200 162 "-" "Mozilla/5.0 (compatible; MJ12bot/v1.4.8; http://www.majestic12.co.uk/bot.php?+)"
234.234.234.234 - - [16/Jul/2023:22:22:24 +0200] "GET / HTTP/1.1" 200 162 "-" "Mozilla/5.0 (compatible; MJ12bot/v1.4.8; http://www.majestic12.co.uk/bot.php?+)"
a lot of traffic may be caused by a bot (or several). There could also be lines like
Code:
123.123.123.123 - - [02/Nov/2023:15:04:33 +0100] "GET //domain.tld/wp-content/plugins/woocommerce/assets/js/zoom/jquery.zoom.min.js HTTP/1.0" 301 728 "-" "Mozilla/5.0 (Linux; Android 7.1.1; XT1710-02 Build/NDS26.74-36) AppleWebKit/537.36 (KHTML, like Gecko) Chrome/59.0.3071.125 Mobile Safari/537.36"
123.123.123.123 - - [02/Nov/2023:15:04:32 +0100] "GET //domain.tld/wp-content/plugins/borlabs-cookie/assets/javascript/borlabs-cookie.min.js HTTP/1.0" 301 737 "-" "Mozilla/5.0 (Macintosh; Intel Mac OS X 10_14_6) AppleWebKit/537.36 (KHTML, like Gecko) Chrome/100.0.4896.127 Safari/537.36"
123.123.123.123 - - [02/Nov/2023:15:04:33 +0100] "GET //domain.tld/wp-content/plugins/quform/cache/quform.js HTTP/1.0" 301 705 "-" "Mozilla/5.0 (X11; Linux x86_64; rv:15.0) Gecko/20120724 Debian Iceweasel/15.02"
where some hacker script is trying to find out more information about your website. Or scans for author IDs like
Code:
123.123.123.123 - - [17/Dec/2023:23:44:15 +0100] "GET /?author=10 HTTP/1.0" 404 45852 "-" "Mozilla/5.0 (Windows NT 6.1; Win64; x64; rv:61.0) Gecko/20100101 Firefox/61.0"
123.123.123.123 - - [17/Dec/2023:23:44:15 +0100] "GET /?author=11 HTTP/1.0" 404 45852 "-" "Mozilla/5.0 (Windows NT 6.1; Win64; x64; rv:61.0) Gecko/20100101 Firefox/61.0"
or for passwords like
Code:
123.123.123.123 - - [22/Oct/2023:19:09:06 +0200] "GET /opt/data/secrets/aws.csv HTTP/1.1" 301 162 "-" "Mozilla/5.0 (Windows NT 10.0; WOW64) AppleWebKit/537.36 (KHTML, like Gecko) Chrome/100.0.4896.127 Safari/537.36"
123.123.123.123 - - [22/Oct/2023:19:09:06 +0200] "GET /usr/local/etc/aws/config.json HTTP/1.1" 301 162 "-" "Mozilla/50 (Windows NT 6.1; WOW64) AppleWebKit/537.36 (KHTML, like Gecko) Chrome/91.0.4472.77 Safari/537.36"
123.123.123.123 - - [22/Oct/2023:19:09:06 +0200] "GET /v1/credentials/aws.json HTTP/1.1" 301 162 "-" "Mozilla/5.0 (iPhone; CPU OS 13_3_1 like Mac OS X) AppleWebKit/605.1.15 (KHTML, like Gecko) FxiOS/28.0  Mobile/15E148 Safari/605.1.15"
All of such useless traffic should be blocked on the server level, meaning either by blocking the requestor's ip address or subnet manually with a suitable iptables command or activating Fail2Ban jail(s) that can cope with that kind of traffic.
You can also display the "top 10" IP addresses from access_ssl_log to find out where most of the load is started at:
awk '{ print $1}' access_ssl_log | sort | uniq -c | sort -nr | head -n 10

What kind of traffic do you see in your logs?
 
OK, I will look at the above. However, if this problem was caused by bot or hacker traffic, I would expect to see that reflected in the process list and not likely to be isolated to woocommerce site (though possible). Rather, I can interact with woocommerce on any of the 5 sites running it and if I click around on one of those sites, I can cause it to dominate the CPU utilization. Just by clicking on view orders, or updating a product, etc. Likewise, via other metrics the traffic stats are steady. (Jetpack, Google analytics, plesk bandwidth). It isn't that the server is handling MORE processes, it is that specific processes are using a lot more CPU each process. Namely php-fpm from woocommerce sites.
 
Update. I've gone through the logs and have not detected any of the above examples or other suspicious activity. It definitely isn't an issue of traffic. Rather something must be configured incorrectly where the php-fpm is requiring a large amount of CPU on Woocommerce sites. Again, this started on a specific date and has remained consistent.
 

Attachments

  • high_cpu_wpsites.jpg
    high_cpu_wpsites.jpg
    170.4 KB · Views: 12
Here is what I see for logs on the hatsoffcoffee site in the screenshot above. It is pretty much just me on the site at the time and as you see the processes are using a very high percentage.


2024-01-19 19:48:13
Access85.208.96.195200GET /product/roasters-choice/ HTTP/1.1
Mozilla/5.0 (compatible; SemrushBot/7~bl; +http://www.semrush.com/bot.html)
18.9 KApache SSL/TLS access
2024-01-19 19:49:12Access209.212.47.89200POST /wp-admin/admin-ajax.php HTTP/1.1
Mozilla/5.0 (Windows NT 10.0; Win64; x64) AppleWebKit/537.36 (KHTML, like Gecko) Chrome/120.0.0.0 Safari/537.36
1.23 KApache SSL/TLS access
2024-01-19 19:49:13Access52.71.31.112200POST /wp-cron.php?doing_wp_cron=1705693753.2840969562530517578125 HTTP/1.1
WordPress/6.4.2; https://www.hatsoffcoffee.com
5.38 KApache SSL/TLS access
2024-01-19 19:49:27Access209.212.47.89200POST /wp-admin/admin-ajax.php HTTP/1.1
Mozilla/5.0 (Windows NT 10.0; Win64; x64) AppleWebKit/537.36 (KHTML, like Gecko) Chrome/120.0.0.0 Safari/537.36
1.23 KApache SSL/TLS access
2024-01-19 19:50:32Access209.212.47.89200GET /shop/ HTTP/1.1
Mozilla/5.0 (Windows NT 10.0; Win64; x64) AppleWebKit/537.36 (KHTML, like Gecko) Chrome/120.0.0.0 Safari/537.36
11.4 KApache SSL/TLS access
2024-01-19 19:50:33Access52.71.31.112200POST /wp-cron.php?doing_wp_cron=1705693833.1780750751495361328125 HTTP/1.1
WordPress/6.4.2; https://www.hatsoffcoffee.com
5.38 KApache SSL/TLS access
2024-01-19 19:50:33Access209.212.47.89200GET /wp-content/uploads/2022/11/decaf_bag-300x300.jpg HTTP/1.1
Mozilla/5.0 (Windows NT 10.0; Win64; x64) AppleWebKit/537.36 (KHTML, like Gecko) Chrome/120.0.0.0 Safari/537.36
16.5 KApache SSL/TLS access
2024-01-19 19:50:33Access209.212.47.89200GET /wp-content/uploads/2022/12/single_origin_2-2-300x300.jpg HTTP/1.1
Mozilla/5.0 (Windows NT 10.0; Win64; x64) AppleWebKit/537.36 (KHTML, like Gecko) Chrome/120.0.0.0 Safari/537.36
14.6 KApache SSL/TLS access
2024-01-19 19:50:33Access209.212.47.89200GET /wp-content/uploads/2022/11/tea_category-300x275.jpg HTTP/1.1
Mozilla/5.0 (Windows NT 10.0; Win64; x64) AppleWebKit/537.36 (KHTML, like Gecko) Chrome/120.0.0.0 Safari/537.36
17.2 KApache SSL/TLS access
2024-01-19 19:50:33Access209.212.47.89200GET /wp-content/uploads/2022/12/gift_card_category-300x300.jpg HTTP/1.1
Mozilla/5.0 (Windows NT 10.0; Win64; x64) AppleWebKit/537.36 (KHTML, like Gecko) Chrome/120.0.0.0 Safari/537.36
19.8 KApache SSL/TLS access
2024-01-19 19:50:33Access209.212.47.89200GET /wp-admin/admin.php?page=stats&noheader&proxy&chart=admin-bar-hours-scale HTTP/1.1
Mozilla/5.0 (Windows NT 10.0; Win64; x64) AppleWebKit/537.36 (KHTML, like Gecko) Chrome/120.0.0.0 Safari/537.36
791Apache SSL/TLS access
2024-01-19 19:50:34Access209.212.47.89200GET /wp-json/jetpack/v4/scan HTTP/1.1
Mozilla/5.0 (Windows NT 10.0; Win64; x64) AppleWebKit/537.36 (KHTML, like Gecko) Chrome/120.0.0.0 Safari/537.36
908Apache SSL/TLS access
 
Woocommerce is known to create a lot of cpu load. I know of users who can reproduce it when they use a mail order processing plugin, e.g. printing labels for the delivery agent.
 
I think we all agree that wordpress and woocommerce have always been resource heavy. The reason for this thread on plesk is:

1. There was a sudden increase in CPU utilization at a specific point in time. It isn't sporadic or a fluctuation - the CPU use went up dramatically and stayed up
2. While WP/Woo show up in the process list as the higher users, this doesn't mean they are the cause, but just the most affected.
3. In support of #2 - non-plesk hosts such as cloudways or wpengine are not experiencing this issue.
4. The problem is affecting sites which have not had any other changes or updates (i.e. plugin updates, increase in traffic such as an attack, etc.)
4. Plesk updates have have resulted in mysterious bugs in the past - look below at "similar threads".
5. There was a Plesk update that is timed in line with this issue. This could be coincidence, but in troubleshooting, has yet to be ruled out.
6. The Plesk product in use is sold specifically as being designed for Wordpress.

I'm more than happy to rule out Plesk as the cause. I've already spent more time and money on trying to figure this out than I like to think about. A week of frustration with no solution in sight. It has been a long time since I've had a server issue like this. And there are at least 3 of us now that are having this issue. I haven't run into anyone on the WP/Woo forums yet that are posting about it.
 
Let's try a different approach.

Plesk itself is not involved in rendering the website at all. It is only involved the moment when a configuration is created. This configuration results in web server and PHP configuration files. These are then used by the web server to render and deliver a site. They can be found in /var/www/vhosts/system/<your domain>/conf. The PHP configuration can be seen in a phpinfo() page or in the /opt/plesk/php/<php version>/etc/conf.d/php-fpm.d/<your domain>.conf file. When you investigate these configuration files, where do you see an entry that could cause a high load on the server, e.g. a misconfiguration? What improvements could be done to these configurations to make the server faster?

- Are you using "proxy mode" and deliver static files through Nginx?
- Do you have enough RAM and enough pm.max_children and pm.max_requests in PHP?
- Is the website using an up-to-date PHP version?
- Have you applied the "Performance Booster" suggestions, such as database server optimizations and PHP optimizations?
 
Thanks for the additional suggestions. We have looked at some of this, but I will go down that list.
 
Just an update here. This has prompted me to do lots of optimizing, security checks, etc. However, I still have no explanation for the sudden increase in CPU usage and I have to continue using the larger EC2 instance (cost more) on AWS. If I ever figure out what the cause is. I will make a point to stop back here and report - in case it helps others.
 
CPU: Intel(R) Core(TM) i7-7700K CPU @ 4.20GHz (8 core(s))
OS: AlmaLinux 9.4 (Seafoam Ocelot)
Product: Plesk Obsidian Version 18.0.62 Update #2, last updated on July 25, 2024 03:27 AM

I am running two active wordpress+woo websites in separate subscriptions that get 50-100 real visitors per month, so really not that many, and some trial installations of wordpress, woo and joomla in other subscriptions with practically no visitors. However, I observe a very similar problem which started around April this year:
My CPU is typically running at 20-30% with less than 5% from the system and all the rest from domains. In the process list I see regularly 10-15 php-fpm processes only from the users of the two active subscriptions each using 2-5% of CPU. These processes don't run continously but get cancelled and new ones are starting with the same users.
Now, since April I had almost daily periods of up to one hour with a steap increase in the CPU usage by these processes that occassionally led to downtime of those domains sometimes affecting also other domains. In order to control this problem, I started implementing certain safety measures - my incoming emails are pre-filtered by an external server, my http and https requested are going through cloudflare, the PLESK firewall blocks all http and https access except for cloudflare (with the exception of access to the PLESK admin panel on HTTP/3) and all SMTP requests except from the external server that pre-filters my incoming email. Fail2Ban is enabled and Apache ModSecurity 2.9 runs on Comodo rules. I believe this is a pretty safe setup. Since then I observed in fact a fewer such steap increases but they do still happen. So, obviously, a part of the problem was also illegitimate server access.
Now, I have applied the checks proposed in this thread to rule out any server-external sources. I found that I have no surprising bots or hackers or whatever accessing my server, i.e. the above mentioned measures are effective. Also, I observed no particularly increase in I/O data flow. Since only the active websites show high CPU usage, I conclude - like some of the others above in their particular cases - that the problem is caused by php processes on the server which are triggered by legimite user access on the website but generate exceptional irregularly high CPU usage.
Does anyone have suggestions how to dig deeper into that problem to identify the real root cause and to eliminate it? Thanks a lot!
 
Back
Top