• Our team is looking to connect with folks who use email services provided by Plesk, or a premium service. If you'd like to be part of the discovery process and share your experiences, we invite you to complete this short screening survey. If your responses match the persona we are looking for, you'll receive a link to schedule a call at your convenience. We look forward to hearing from you!
  • We are looking for U.S.-based freelancer or agency working with SEO or WordPress for a quick 30-min interviews to gather feedback on XOVI, a successful German SEO tool we’re looking to launch in the U.S.
    If you qualify and participate, you’ll receive a $30 Amazon gift card as a thank-you. Please apply here. Thanks for helping shape a better SEO product for agencies!
  • The BIND DNS server has already been deprecated and removed from Plesk for Windows.
    If a Plesk for Windows server is still using BIND, the upgrade to Plesk Obsidian 18.0.70 will be unavailable until the administrator switches the DNS server to Microsoft DNS. We strongly recommend transitioning to Microsoft DNS within the next 6 weeks, before the Plesk 18.0.70 release.
  • The Horde component is removed from Plesk Installer. We recommend switching to another webmail software supported in Plesk.

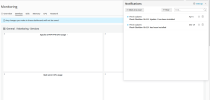
Issue Monitoring: All graphs empty, error="request handler error: [plugin.notRegistered] plugin not registered" in log

mow

Silver Pleskian
Server operating system version
Debian 11.6 x86_64
Plesk version and microupdate number
Plesk Obsidian 18.0.51.1
Hi,

in Monitoring I only see empty graphs:
1681392791056.png

I first noticed this after upgrading from debian 9 to 10 and then to 11.
There are no errors about grafana or monitoring logged in panel.log, only four
[2023-04-13 00:00:01.829] 1920545:643729e1ca6ea ERR [panel] Unable to get key: Repository is not opened
every day (but I can log into the panel and use everything).

/var/log/grafana/grafana.log complains about not registered plugins, e.g.:
logger=alerting.evalContext t=2023-04-13T15:34:03.004744718+02:00 level=error msg="Alert Rule Result Error" ruleId=4 name="MySQL memory usage" error="request handler error: [plugin.notRegistered] plugin not registered" changingstateto=keep_state
logger=alerting.evalContext t=2023-04-13T15:34:03.005355123+02:00 level=error msg="Alert Rule Result Error" ruleId=5 name="Plesk memory usage" error="request handler error: [plugin.notRegistered] plugin not registered" changingstateto=keep_state

What do?
 
I cannot find anything on the specific error message, but other documentation suggests that either the repository from where Grafana is installed, is outdated or was a custom repository when it was first installed. One approach could be to remove Grafana and reinstall it, e.g. first check that the repository is pointing to the right source and not a customized one:

Code:
# cat /etc/apt/sources.list.d/plesk-ext-grafana.list
deb https://autoinstall.plesk.com/grafana/deb stable main

then remove grafana and monitoring
Code:
# plesk bin extension -u grafana
# plesk bin extension -u monitoring
# apt purge grafana && rm -rf /usr/share/grafana /etc/grafana /var/lib/grafana

then reinstall monitoring
Code:
# plesk bin extension -i monitoring

then navigate to extensions in GUI, open Monitoring and select "Use built-in monitoring".

Not tested, but as I know you're quite knowledgeable I am sure you know what this does. If you have doubts, this case would be worth an official support ticket, too.
 
I cannot find anything on the specific error message, but other documentation suggests that either the repository from where Grafana is installed, is outdated or was a custom repository when it was first installed. One approach could be to remove Grafana and reinstall it, e.g. first check that the repository is pointing to the right source and not a customized one:

Code:
# cat /etc/apt/sources.list.d/plesk-ext-grafana.list
deb https://autoinstall.plesk.com/grafana/deb stable main
This has been moved to plesk's new location (as above) during or after the dist upgrade, and then recently got the pinned key mentioned in another thread:
Code:
deb [signed-by=/etc/apt/keyrings/plesk-ext-grafana.gpg] https://autoinstall.plesk.com/grafana/deb stable main

The versions look fine, too:
monitoring/meta.xml: <version>2.5.9</version>
grafana/meta.xml: <version>1.4.3</version>

Generally updates should be current, though I don't know why GUI shows this:
1681400132676.png
and shell this:
Code:
 # apt-get upgrade
Reading package lists... Done
Building dependency tree... Done
Reading state information... Done
Calculating upgrade... Done
The following package was automatically installed and is no longer required:
  libpng12-0
Use 'apt autoremove' to remove it.
The following packages have been kept back:
  linux-image-amd64
The following packages will be upgraded:
  ghostscript libgs9 libgs9-common
3 upgraded, 0 newly installed, 0 to remove and 1 not upgraded.
Need to get 3,076 kB of archives.
After this operation, 0 B of additional disk space will be used.
(is now upgraded)


Removed, reinstalled, and
then navigate to extensions in GUI, open Monitoring and select "Use built-in monitoring".
Works now.

And now I see what has been the problem:
ii grafana 8.5.21 amd64 Grafana

Before the purge it was:
ii grafana 9.2.3 amd64 Grafana

So it somehow managed to grab a newer incompatible version, probably directly from grafana when it was still sourced from there before they restructured their server and plesk went to host it in their own repository.
 
Back
Top