hi.
recently my server send me that Alaram every day (morning between 6:00 AM to 11:00 AM)
this what i got:
why this happend and how can i fix that ?
regards,
Tomer.
recently my server send me that Alaram every day (morning between 6:00 AM to 11:00 AM)
this what i got:
why this happend and how can i fix that ?
regards,
Tomer.
Code:
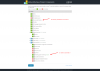
Server health parameter "Services > MySQL CPU usage" changed its status from "green" to "red".

top - 06:29:18 up 15:55,  0 users,  load average: 2.02, 2.11, 1.63
Tasks: 144 total,  13 running, 131 sleeping,   0 stopped,   0 zombie
%Cpu(s): 13.1 us,  3.6 sy,  0.2 ni, 76.8 id,  6.2 wa,  0.0 hi,  0.1 si,  0.0 st
KiB Mem:   3949820 total,  3136972 used,   812848 free,    90968 buffers
KiB Swap:        0 total,        0 used,        0 free.  2162292 cached Mem

  PID USER      PR  NI    VIRT    RES    SHR S  %CPU %MEM     TIME+ COMMAND
20501 psaadm    20   0  278276  34180  18972 R  32.5  0.9   0:00.10 sw-engine
20505 psaadm    20   0  275736  30940  18664 R  26.0  0.8   0:00.07 sw-engine
20511 psaadm    20   0  275540  30536  18712 R  26.0  0.8   0:00.06 sw-engine
20497 psaadm    20   0  278328  33992  18972 R  19.5  0.9   0:00.10 sw-engine
20503 psaadm    20   0  278276  34180  18972 R  19.5  0.9   0:00.08 sw-engine
20507 psaadm    20   0  274408  29208  18752 R  19.5  0.7   0:00.05 sw-engine
20519 psaadm    20   0  274408  29552  18760 R  19.5  0.7   0:00.05 sw-engine
20521 psaadm    20   0  255028  18136  14480 R  13.0  0.5   0:00.02 sw-engine
 1195 mysql     20   0 1353600 261276   7720 S   6.5  6.6  34:35.87 mysqld
17973 tmanow77  20   0  488900  52812  32540 R   6.5  1.3   0:05.86 php-fpm
20499 psaadm    20   0  278020  33320  18732 R   6.5  0.8   0:00.08 sw-engine
    1 root      20   0   33508   2856   1452 S   0.0  0.1   0:01.41 init
    2 root      20   0       0      0      0 S   0.0  0.0   0:00.01 kthreadd
    3 root      20   0       0      0      0 S   0.0  0.0   0:00.09 ksoftirqd/0
    5 root       0 -20       0      0      0 S   0.0  0.0   0:00.00 kworker/0:+
    6 root      20   0       0      0      0 S   0.0  0.0   0:03.48 kworker/u4+
    7 root      20   0       0      0      0 S   0.0  0.0   0:57.53 rcu_sched
    8 root      20   0       0      0      0 S   0.0  0.0   0:29.05 rcuos/0
    9 root      20   0       0      0      0 S   0.0  0.0   0:38.68 rcuos/1
   10 root      20   0       0      0      0 S   0.0  0.0   0:00.00 rcu_bh
   11 root      20   0       0      0      0 S   0.0  0.0   0:00.00 rcuob/0
   12 root      20   0       0      0      0 S   0.0  0.0   0:00.00 rcuob/1
   13 root      rt   0       0      0      0 S   0.0  0.0   0:00.70 migration/0
   14 root      rt   0       0      0      0 S   0.0  0.0   0:00.32 watchdog/0
   15 root      rt   0       0      0      0 S   0.0  0.0   0:00.28 watchdog/1
   16 root      rt   0       0      0      0 S   0.0  0.0   0:00.64 migration/1
   17 root      20   0       0      0      0 S   0.0  0.0   0:00.64 ksoftirqd/1
   18 root      20   0       0      0      0 S   0.0  0.0   0:00.00 kworker/1:0
   19 root       0 -20       0      0      0 S   0.0  0.0   0:00.00 kworker/1:+
   20 root       0 -20       0      0      0 S   0.0  0.0   0:00.00 khelper
   21 root      20   0       0      0      0 S   0.0  0.0   0:00.00 kdevtmpfs
   22 root       0 -20       0      0      0 S   0.0  0.0   0:00.00 netns
   23 root       0 -20       0      0      0 S   0.0  0.0   0:00.00 writeback
   24 root       0 -20       0      0      0 S   0.0  0.0   0:00.00 kintegrityd
   25 root       0 -20       0      0      0 S   0.0  0.0   0:00.00 bioset
   27 root       0 -20       0      0      0 S   0.0  0.0   0:00.00 kblockd
   28 root       0 -20       0      0      0 S   0.0  0.0   0:00.00 ata_sff
   29 root      20   0       0      0      0 S   0.0  0.0   0:00.00 khubd
   30 root       0 -20       0      0      0 S   0.0  0.0   0:00.00 md
   31 root       0 -20       0      0      0 S   0.0  0.0   0:00.00 devfreq_wq
   32 root      20   0       0      0      0 S   0.0  0.0   0:03.01 kworker/0:1
   33 root      20   0       0      0      0 S   0.0  0.0   0:03.53 kworker/1:1
   35 root      20   0       0      0      0 S   0.0  0.0   0:00.09 khungtaskd
   36 root      20   0       0      0      0 S   0.0  0.0   0:00.36 kswapd0
   37 root       0 -20       0      0      0 S   0.0  0.0   0:00.00 vmstat
   38 root      25   5       0      0      0 S   0.0  0.0   0:00.00 ksmd
   39 root      39  19       0      0      0 S   0.0  0.0   0:03.31 khugepaged
   40 root      20   0       0      0      0 S   0.0  0.0   0:00.00 fsnotify_m+
   41 root      20   0       0      0      0 S   0.0  0.0   0:00.00 ecryptfs-k+
   42 root       0 -20       0      0      0 S   0.0  0.0   0:00.00 crypto
   54 root       0 -20       0      0      0 S   0.0  0.0   0:00.00 kthrotld
   55 root      20   0       0      0      0 S   0.0  0.0   0:00.00 kworker/u4+
   56 root      20   0       0      0      0 S   0.0  0.0   0:04.78 vballoon
   57 root      20   0       0      0      0 S   0.0  0.0   0:00.00 scsi_eh_0
   58 root      20   0       0      0      0 S   0.0  0.0   0:00.00 scsi_eh_1
   79 root       0 -20       0      0      0 S   0.0  0.0   0:00.00 deferwq
   80 root       0 -20       0      0      0 S   0.0  0.0   0:00.00 charger_ma+
  124 root       0 -20       0      0      0 S   0.0  0.0   0:00.00 kpsmoused
  125 root      20   0       0      0      0 S   0.0  0.0   0:00.00 kworker/0:2
  192 root      20   0       0      0      0 D   0.0  0.0   0:32.69 jbd2/vda1-8
  193 root       0 -20       0      0      0 S   0.0  0.0   0:00.00 ext4-rsv-c+
  357 root      20   0   19472    640    456 S   0.0  0.0   0:00.10 upstart-ud+
  376 root      20   0   49748   1704    980 S   0.0  0.0   0:00.14 systemd-ud+
  443 message+  20   0   39108    884    540 S   0.0  0.0   0:00.06 dbus-daemon
  448 syslog    20   0  255836   3680    768 S   0.0  0.1   0:00.60 rsyslogd
  524 root       0 -20       0      0      0 S   0.0  0.0   0:00.00 kvm-irqfd-+
  580 root      20   0   35016   1548   1248 S   0.0  0.0   0:00.00 systemd-lo+
  593 root      20   0   15256    620    420 S   0.0  0.0   0:00.05 upstart-so+
  698 root      20   0   10224   2816    516 S   0.0  0.1   0:00.00 dhclient
  887 root      20   0   15272    620    432 S   0.0  0.0   0:00.04 upstart-fi+
  925 root      20   0   15016    944    784 S   0.0  0.0   0:00.00 getty
  928 root      20   0   15016    936    784 S   0.0  0.0   0:00.00 getty
  937 root      20   0   15016    936    784 S   0.0  0.0   0:00.00 getty
  938 root      20   0   15016    944    784 S   0.0  0.0   0:00.00 getty
  941 root      20   0   15016    944    784 S   0.0  0.0   0:00.00 getty
  970 root      20   0   14988   1016    828 S   0.0  0.0   0:00.00 xinetd
  971 root      20   0   61376   3064   2380 S   0.0  0.1   0:00.08 sshd
 1016 root      20   0    4364    628    480 S   0.0  0.0   0:00.00 acpid
 1033 root      20   0   19188    732    500 S   0.0  0.0   0:02.63 irqbalance
 1035 bind      20   0  239992  16256   2144 S   0.0  0.4   0:00.06 named
 1063 root      20   0    4336    440    340 S   0.0  0.0   0:00.00 courierlog+
 1064 root      20   0   26000   1416   1048 S   0.0  0.0   0:00.01 authdaemond
 1088 root      20   0    4336    340    248 S   0.0  0.0   0:00.00 courierlog+
 1089 root      20   0   12164    900    744 S   0.0  0.0   0:00.00 couriertcpd
 1113 root      20   0    4336    444    340 S   0.0  0.0   0:00.00 courierlog+
 1114 root      20   0   12164    900    744 S   0.0  0.0   0:00.00 couriertcpd
 1137 root      20   0    4336    336    248 S   0.0  0.0   0:00.00 courierlog+
 1138 root      20   0   12164    900    744 S   0.0  0.0   0:00.00 couriertcpd
 1149 root      20   0   26000    372      0 S   0.0  0.0   0:00.01 authdaemond
 1150 root      20   0   26000    372      0 S   0.0  0.0   0:00.01 authdaemond
 1151 root      20   0   26000    372      0 S   0.0  0.0   0:00.01 authdaemond
 1152 root      20   0   26000    372      0 S   0.0  0.0   0:00.01 authdaemond
 1153 root      20   0   26000    372      0 S   0.0  0.0   0:00.01 authdaemond
 1167 root      20   0    4336    444    340 S   0.0  0.0   0:00.00 courierlog+
 1168 root      20   0   12164    896    744 S   0.0  0.0   0:00.00 couriertcpd
 1181 root      20   0   23648   1024    764 S   0.0  0.0   0:00.55 cron
 1182 daemon    20   0   19132    160      0 S   0.0  0.0   0:00.00 atd
 1234 root      20   0   44788   8540   1984 S   0.0  0.2   0:00.42 fail2ban-s+
 1381 root      20   0   28332   1240    224 S   0.0  0.0   0:00.00 nginx
 1382 nginx     20   0   29312   4392   1916 S   0.0  0.1   2:33.15 nginx
 1409 postfix   20   0  398804    892    692 S   0.0  0.0   0:01.10 psa-pc-rem+
 1481 root      20   0  399940   8964   1888 S   0.0  0.2   0:08.55 php-fpm
 1588 root      20   0   25336   1684   1356 S   0.0  0.0   0:07.79 master
 1612 postfix   20   0   27568   1760   1428 S   0.0  0.0   0:05.96 qmgr
 2089 root      20   0  375112   9748    872 S   0.0  0.2   0:00.00 sw-engine-+
 2224 root      20   0   37456   1720    220 S   0.0  0.0   0:00.00 sw-cp-serv+
 2225 sw-cp-s+  20   0   38336   4112   1772 S   0.0  0.1   0:00.33 sw-cp-serv+
 2490 root      20   0  144040  12176   6088 S   0.0  0.3   0:05.27 /usr/sbin/+
 2493 www-data  20   0  141224   4232    384 S   0.0  0.1   0:00.93 /usr/sbin/+
 2496 root      20   0       0      0      0 S   0.0  0.0   0:00.00 kauditd
 2818 root      20   0  289176  32256   6120 S   0.0  0.8   0:03.62 sw-engine
 2848 root      20   0  549636   2980    920 S   0.0  0.1   0:13.96 sw-collectd
 2976 root      20   0   15016    944    784 S   0.0  0.0   0:00.00 getty
 2982 root      20   0   12780    840    696 S   0.0  0.0   0:00.01 getty
3605 postfix 20 0 40172 2756 2208 S 0.0 0.1 0:00.05 tlsmgr")