- Server operating system version
- Ubuntu 20.04.6 LTS
- Plesk version and microupdate number
- Plesk Obsidian Version 18.0.54
Hi I am new to Plesk and working on a new server.
Troubleshooting frequent “excessive resource usage” error messages from new Plesk Server, because they are there. (should I?)
Time: Wed Aug 30 06:36:07 2023 +0000
Account: psaadm
Resource: Process Time
Exceeded: 1827 > 1800 (seconds)
Executable: /usr/sbin/sw-engine-fpm
Command Line: sw-engine-fpm: pool plesk
PID: 39942 (Parent PID:535)
Killed: No
Plesk obsidian psaadm “excessive resource usage”
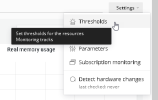
How do I raise the limit for Plesk obsidian psaadm “excessive resource usage” from 1800 to 2000 seconds
Also getting frequent “Error” notices for the following as well
Plesk Obsidian systemd-network process time exceeded 1800 seconds
Syslog
Systemd-timesync
Daemon
Getting some
Grafana Resource: Virtual Memory Size Exceeded: 1500 > 512 (MB)
Plesk-ssh-terminal
On my previous server, Cpanel, I would have increased the limits a bit to see if that cured the problem but I don’t see how to adjust that.
Should I adjust the limits or block the notices and if so, how is that done.

