• We value your experience with Plesk during 2024
    Plesk strives to perform even better in 2025. To help us improve further, please answer a few questions about your experience with Plesk Obsidian 2024.
    Please take this short survey:

    https://pt-research.typeform.com/to/AmZvSXkx
  • The Horde webmail has been deprecated. Its complete removal is scheduled for April 2025. For details and recommended actions, see the Feature and Deprecation Plan.
  • We’re working on enhancing the Monitoring feature in Plesk, and we could really use your expertise! If you’re open to sharing your experiences with server and website monitoring or providing feedback, we’d love to have a one-hour online meeting with you.

Issue Slow client download speeds for large files

SolarStorm

New Pleskian
Server operating system version
Alma Linux 8 - Linux 4.18.0-513.5.1.el8_9.x86_64
Plesk version and microupdate number
Version 18.0.61 Update #3
Hello everyone,

I'm new to Plesk, coming from a Cpanel server. I'm in the middle of migrating to Plesk and have discovered an issue which I'd like to share, just in case someone can assist.

Both Cpanel and Plesk servers are with the same hosting provider and have an identical performance metric.

e.g DD shows the same nvme speed, WGET also shows similar download speeds.

The problem is when a client is trying to fetch a large from from the Plesk server, where performance is severely degraded, to the point it stalls many times and sometimes fails to download.

To keep the environments as identical as possible, I've placed the same 500MB test download file on both production (Cpanel) and new Plesk servers. In the attached image, you'll notice the file being downloaded at almost 4MB/sec while the Plesk site download speed is between 100KB/sec - 400KB/sec. This particular download from the Plesk server failed.

I've been working with my hosting support on this for a few days now but I can't figureout where the issue is. My home connection is a 40Mb/sec download. I performed these tests from work (1 Gig fibre) and the results are similar.

I noticed that Plesk is using Ngix and found some similar documentation where users were expericing the same slow download speeds, tried the suggestions (disable Ngix proxy etc) but it made no difference.

Closing, I should note that the CMS I loaded on the Plesk server worked nice and fast - the problem seems to be focused purely on downloads. I also had very low download speeds even when using FTP or the Plesk GUI File Manager.

If anyone has any suggestions, I'd really appreciate it.

Many thanks,

Chris.
 

Attachments

  • 2024-05-27_08-09-04 Download test.png
    2024-05-27_08-09-04 Download test.png
    25.3 KB · Views: 7
Strange, there is no throttling or imposed download limit in Plesk. Don't hesitate to reach out to our support team for an investigation.
Kaspar,

Thanks for your reply. I know this is a really odd issue. My hosting provider has already opened a support ticket with Plesk, but they are taking 12+ hours to reply back.

In their initial reply, they tested download speeds from the server using WGET and achieved 20+MB/Sec, however when they tried via HTTPS, the download slowed down to 11KB/sec! They are now checking with the developers.

I'm contemplating if I should open a new ticket directly with them or not!

Am I able to supply the download URL and see what speeds others reading this thread are achieving?
 
Excellent. I'd really appreciate it if people can test this and provide screenshots of their download speeds. It would be super useful to also know their location and link speed.

Keep it mind that the download starts somewhat fast, but quickly slows down.

Link: https://www.nightsky.gr/500MB

Thank you very much!
 
Thanks Kaspar for the feedback and info - Can you please try it with a normal web browser as that where the problem seems to easily replicate. Plesk support got similar speeds with WGET, but only a few KB/sec when using a normal GUI browser.

Thank you.
 
Thanks Kaspar for the feedback and info - Can you please try it with a normal web browser as that where the problem seems to easily replicate. Plesk support got similar speeds with WGET, but only a few KB/sec when using a normal GUI browser.

Thank you.
The 12 MB/s where via browser on my desktop computer.
 
Hello!
sorry to bring up this old topic, but I'm in the same situation.
To sum up, using a browser, via the website the download speed is not good (1.8Mb/s) whereas using FTP or the Plesk browser interface the speeds are OK, around 50Mb/s .

This is a production server, so restarting in rescue mode is not an option unless it's perfectly justified.

I thought there was a default value for example in nginx: such as “limit_rate”. If you set a lower value, it limits, but if you set a higher value, my value remains limited.

I've contacted Plesk support, and OVH support, and unfortunately I haven't had any solutions to my problem.

A BIG THANK YOU in advance for your help
Hello NbzSys,

I spent counteless of hours trying to get down to the bottom of this issue and with my hosting provider's help, we were able to finally find a solution that worked.

Here are the two changes to the server TCP setting that made the difference:

1. enabled net.ipv4.tcp_sack

Selective Acknowledgment (SACK) is a mechanism that allows the receiver of TCP data to specify which segments of data have been received successfully, even if other segments were lost or not received.

2. Changed net.ipv4.tcp_retries1=5 from 3, and net.ipv4.tcp_retries2=25 from 15
Controls the number of times a TCP segment will be retransmitted before giving up on the connection if no acknowledgment is received. It is an important part of TCP's retransmission mechanism, helping to ensure reliable data transfer.

The technician's comments were the following: "I knew it had something to do with the TCP retransmission and the way segments appears to have been received seemed odd, so those 2 parameters help maintain the integrity of the connection and specifying already received data so its not duplicated (which I think is partly why we may have been seeing the duplicate acks as they may have been timing out and the server was resending the same ack but not 100% certain on that part) "

I hope this helps you and others, as it took us 4-5 months to get to this conclusion.

Chris.
 
many thanks for your prompt reply.
I think I have done what is necessary on my machine.
Before modification I had these values:

Bash:
# sysctl net.ipv4.tcp_sack net.ipv4.tcp_retries1 net.ipv4.tcp_retries2
net.ipv4.tcp_sack = 1
net.ipv4.tcp_retries1 = 3
net.ipv4.tcp_retries2 = 15

and then :


Bash:
# sysctl net.ipv4.tcp_sack net.ipv4.tcp_retries1 net.ipv4.tcp_retries2
net.ipv4.tcp_sack = 1
net.ipv4.tcp_retries1 = 5
net.ipv4.tcp_retries2 = 25


I applied the changes with the command :

Bash:
 # sudo sysctl -p


And after these modifications, I unfortunately don't see any change.
Through the Plesk interface I'm still downloading at 50Mb/s and through the website at 1.8Mb/s. Interestingly, I can download 2 files at this speed.

if it helps, here's the return from my netstat command:


Bash:
# netstat -s
Ip:
    Forwarding: 1
    87226237470 total packets received
    22 with invalid addresses
    197263 forwarded
    2762 with unknown protocol
    0 incoming packets discarded
    87158239023 incoming packets delivered
    86851490492 requests sent out
    11 outgoing packets dropped
    2521 fragments dropped after timeout
    4316272 reassemblies required
    45916 packets reassembled ok
    4096179 packet reassemblies failed
    295 fragments received ok
    34 fragments failed
    590 fragments created
Icmp:
    26775698 ICMP messages received
    294345 input ICMP message failed
    InCsumErrors: 261
    ICMP input histogram:
        destination unreachable: 741464
        timeout in transit: 30435
        redirects: 103475
        echo requests: 25899033
        echo replies: 629
        timestamp request: 232
        address mask request: 132
    42153298 ICMP messages sent
    0 ICMP messages failed
    ICMP output histogram:
        destination unreachable: 16233342
        time exceeded: 155
        echo requests: 20536
        echo replies: 25899033
        timestamp replies: 232
IcmpMsg:
        InType0: 629
        InType1: 21
        InType3: 741464
        InType5: 103475
        InType8: 25899033
        InType11: 30435
        InType13: 232
        InType15: 10
        InType17: 132
        InType37: 2
        InType69: 4
        OutType0: 25899033
        OutType3: 16233342
        OutType8: 20536
        OutType11: 155
        OutType14: 232
Tcp:
    511471878 active connection openings
    628845036 passive connection openings
    1643741 failed connection attempts
    52334085 connection resets received
    129 connections established
    87074991803 segments received
    99559079418 segments sent out
    451755450 segments retransmitted
    1884355 bad segments received
    243598932 resets sent
    InCsumErrors: 1852115
Udp:
    90401317 packets received
    496824 packets to unknown port received
    4682 packet receive errors
    90481250 packets sent
    0 receive buffer errors
    0 send buffer errors
    InCsumErrors: 4680
UdpLite:
TcpExt:
    2714827 SYN cookies sent
    5398344 SYN cookies received
    1270157 invalid SYN cookies received
    734059 resets received for embryonic SYN_RECV sockets
    546900 packets pruned from receive queue because of socket buffer overrun
    3175 ICMP packets dropped because they were out-of-window
    407295850 TCP sockets finished time wait in fast timer
    1299650 time wait sockets recycled by time stamp
    24669742 packetes rejected in established connections because of timestamp
    588478688 delayed acks sent
    4420847 delayed acks further delayed because of locked socket
    Quick ack mode was activated 13450662 times
    53394747 times the listen queue of a socket overflowed
    53398233 SYNs to LISTEN sockets dropped
    61033625695 packet headers predicted
    6253669000 acknowledgments not containing data payload received
    55098950882 predicted acknowledgments
    49951 times recovered from packet loss due to fast retransmit
    TCPSackRecovery: 41066964
    TCPSACKReneging: 17279132
    Detected reordering 34158471 times using SACK
    Detected reordering 145014 times using reno fast retransmit
    Detected reordering 562012 times using time stamp
    129744 congestion windows fully recovered without slow start
    458140 congestion windows partially recovered using Hoe heuristic
    TCPDSACKUndo: 341833
    902859 congestion windows recovered without slow start after partial ack
    TCPLostRetransmit: 55759421
    13702 timeouts after reno fast retransmit
    TCPSackFailures: 222054
    5660958 timeouts in loss state
    292642441 fast retransmits
    106548236 retransmits in slow start
    TCPTimeouts: 41250118
    TCPLossProbes: 15341379
    TCPLossProbeRecovery: 2028236
    TCPRenoRecoveryFail: 4800
    TCPSackRecoveryFail: 13168461
    TCPDSACKOldSent: 13499115
    TCPDSACKOfoSent: 26293
    TCPDSACKRecv: 10096673
    TCPDSACKOfoRecv: 143720
    102454611 connections reset due to unexpected data
    32874306 connections reset due to early user close
    563019 connections aborted due to timeout
    TCPSACKDisc

A big thank you in advance
 
And after these modifications, I unfortunately don't see any change.
Through the Plesk interface I'm still downloading at 50Mb/s and through the website at 1.8Mb/s. Interestingly, I can download 2 files at this speed.
Did you check whether you're connecting to the website by ipv4?
What's your MTU?

These are suspicious:
4316272 reassemblies required
45916 packets reassembled ok
4096179 packet reassemblies failed
546900 packets pruned from receive queue because of socket buffer overrun
24669742 packetes rejected in established connections because of timestamp
4420847 delayed acks further delayed because of locked socket
53398233 SYNs to LISTEN sockets dropped
 
Did you check whether you're connecting to the website by ipv4?
-> you make me doubt, but I have configured only DNS to point to my IP failover V4 address

here's my ifconfig (I've just anonymized my IP addresses) :
eno1 is server IP and eno1:1 is my ip failover that I use for all my websites.

Code:
eno1: flags=4163<UP,BROADCAST,RUNNING,MULTICAST>  mtu 1500
        inet 51.xxx.xxx.xxx  netmask 255.255.255.0  broadcast 51.210.240.255
        inet6 fe80::d250:99ff:fedc:21e0  prefixlen 64  scopeid 0x20<link>
        ether d0:50:99:dc:21:e0  txqueuelen 1000  (Ethernet)
        RX packets 10574893681  bytes 6733029124332 (6.1 TiB)
        RX errors 0  dropped 0  overruns 0  frame 0
        TX packets 22424373015  bytes 28022126866452 (25.4 TiB)
        TX errors 0  dropped 0 overruns 0  carrier 0  collisions 0

eno1:1: flags=4163<UP,BROADCAST,RUNNING,MULTICAST>  mtu 1500
        inet 5.xxx.xxx.xxx  netmask 255.255.255.255  broadcast 5.196.58.241
        ether d0:50:99:dc:21:e0  txqueuelen 1000  (Ethernet)

I've also tested downloading from a domain pointing ipv4 to my server's IP directly and the problem is the same.
 
Does it get faster if you lower the MTU to 1492 or less? If yes, then MTU Path Discovery is broken.
 
speed remains approximately the same, or even lower.

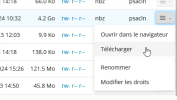
I'd like to point out that when using the Plesk interface (télécharger in french mean download), download speeds are quite reasonable (around 50MB/s), compared with 2MB/s when downloading via the website.

1728399286639.png
Maybe it's a coincidence, but some customers are reporting 502 errors with errors like this in the log:

Code:
2024/10/08 16:16:43 [error] upstream prematurely closed connection while reading response header from upstream, client: [anonymized], server: [anonymized], request: "POST /wp-admin/admin-ajax.php HTTP/2.0", upstream: "[anonymized]", host: "[anonymized]", referrer: "[anonymized]"
2024/10/08 16:16:44 [error] upstream prematurely closed connection while reading response header from upstream, client: [anonymized], server: [anonymized], request: "POST /wp-admin/admin-ajax.php HTTP/2.0", upstream: "[anonymized]", host: "[anonymized]", referrer: "[anonymized]"
2024/10/08 16:16:45 [error] upstream prematurely closed connection while reading response header from upstream, client: [anonymized], server: [anonymized], request: "POST /wp-admin/admin-ajax.php HTTP/2.0", upstream: "[anonymized]", host: "[anonymized]", referrer: "[anonymized]"
2024/10/08 16:16:47 [error] upstream prematurely closed connection while reading response header from upstream, client: [anonymized], server: [anonymized], request: "POST /wp-admin/admin-ajax.php HTTP/2.0", upstream: "[anonymized]", host: "[anonymized]", referrer: "[anonymized]"
 
some news in case anyone sees this topic.
The previous errors were related to modsecurity false positives. Once disabled on the domains, the 502 errors no longer reappeared on the domains concerned.
Download speed still low
 
download speeds are quite reasonable (around 50MB/s), compared with 2MB/s when downloading via the website.
When you download it via panel, no such rules apply, the file is treated as a static file. But when you download it via a website, it is delivered by the Apache webserver, and this could mean that either some specific MIME type is set or an .htaccess rule influences file access.

What's the file type and what are the MIME settings of the website? Maybe your browser thinks it has to process the file in some special way? Maybe an antivirus add-on processes the file when it is downloaded from the website, because it is not seen as an ordinary file? Are there .htaccess rules in Apache that affect the file in any way?
 
hello
thank you for your answer, I made several tests with different format (*.7z, *.png, *.pcap), and the result remains the same (see capture).
With your indications, I tried to activate the static management of nginx without success, and the problem is the same on all the sites of the server (100+ sites).
I also tried disabling the imunify extension, same result.
If you have any clues to try to diagnose. I had made a frame analysis file, but I don't know very well how to interpret it (understand what is normal or abnormal).

1729764574258.png
 
As a small update, I've just done a test on another VPS, running Plesk, and I was able to download the same file via Plesk at a decent speed. Also hosted by OVH.
 
Back
Top