Pascal_Netenvie
Regular Pleskian
- Server operating system version
- Debian 11.6
- Plesk version and microupdate number
- 18.0.51u1
Hello,
I use Plesk + 360 monitoring on 15 to 20 servers.
Most of servers runs on Infomaniak Public cloud with Block storage perf 2 (1000 IOPS and 400 Mo/s).
On those servers no problems (apparently).
But recently i builded a new server with a perf 1 Block storage (limited to 200 Mo/s and 500 IOPS).
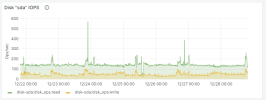
On this new server i have disk busy at 100% all the time and after some test i found that the process generating that seems to be server monitoring.
After i disabled Monitoring extension and killed Statictics_collect task the disk usage came back to normal.
So i wonder if Monitoring is well optimized and don't use too much disk IOPS ...
Because if it use too much disk read, for sure it slow a bit disk access for other processes even on servers with faster disk ...
I would like to have a real feedback from other users and Plesk 360 team.

